The Atmosphere
The atmosphere is the layer of gases held around the Earth by gravity. Aviation divides it into the troposphere, where temperature falls with height and the weather forms, the tropopause, and the stable stratosphere above, and measures it against the International Standard Atmosphere.
The atmosphere is the envelope of gases held around the Earth by gravity. For a pilot it is both the medium that supports the aeroplane and the source of its weather. Its pressure, temperature, density and humidity all vary from place to place and with height, and each of them changes what the altimeter reads, how much lift the wing produces and how much thrust the engines deliver.
Because the real atmosphere never stands still, aviation measures it against an agreed model, the International Standard Atmosphere (ISA). Altimeters, airspeed indicators and performance charts are all calibrated to it, so a working knowledge of the model and of how the real air departs from it underpins altimetry, performance and much of meteorology.
Composition of the atmosphere
Dry air is a mixture of gases whose proportions by volume are:
| Gas | Share of dry air by volume |
|---|---|
| Nitrogen | About 78 per cent |
| Oxygen | About 21 per cent |
| Argon | About 0.9 per cent |
| Carbon dioxide | A few hundredths of one per cent (exam texts quote 0.03 per cent) |
| Other gases, including methane and ozone | Traces |
Turbulent mixing keeps these proportions constant up to about 60 km; above that the gases begin to separate by molecular weight. The exception is ozone, whose concentration varies with height and place. The constancy matters physiologically: oxygen is still 21 per cent of the air at 40,000 ft, and hypoxia at altitude comes from the fall in total pressure, and so in the partial pressure of oxygen, not from any change in the mixture (see hypoxia and hyperventilation).
Water vapour is not counted in the table because its share varies, from almost nothing in polar or desert air to a few per cent in warm, moist air near the surface. Meteorologically it is the most important gas of all. It forms cloud, fog and precipitation, and when it condenses it releases latent heat that drives convection (see humidity and water vapour).
Ozone and greenhouse gases
The greenhouse gases, chiefly water vapour, carbon dioxide and methane, are almost transparent to the short-wave radiation arriving from the sun but absorb the long-wave radiation emitted by the Earth's surface. The atmosphere is therefore heated mainly from below, by the ground and the sea, which is why temperature normally falls with height in the lowest layer. Cloud acts in the same way at night, which is why an overcast night stays warmer than a clear one (see temperature and heat exchange).
Ozone is a form of oxygen with three atoms per molecule. Most of it lies in the stratosphere, where it absorbs ultraviolet radiation from the sun; that absorption heats the upper stratosphere and explains why temperature there rises with height. Ozone is toxic: it irritates the lungs, causes headaches and impairs night vision. Its concentration increases above the tropopause, and where the tropopause is low, as at high latitudes in winter, ozone-rich air can reach normal cruising levels. Jet aircraft reduce it in the cabin air supply, partly through the heat of compression and on many types with catalytic converters.
The troposphere
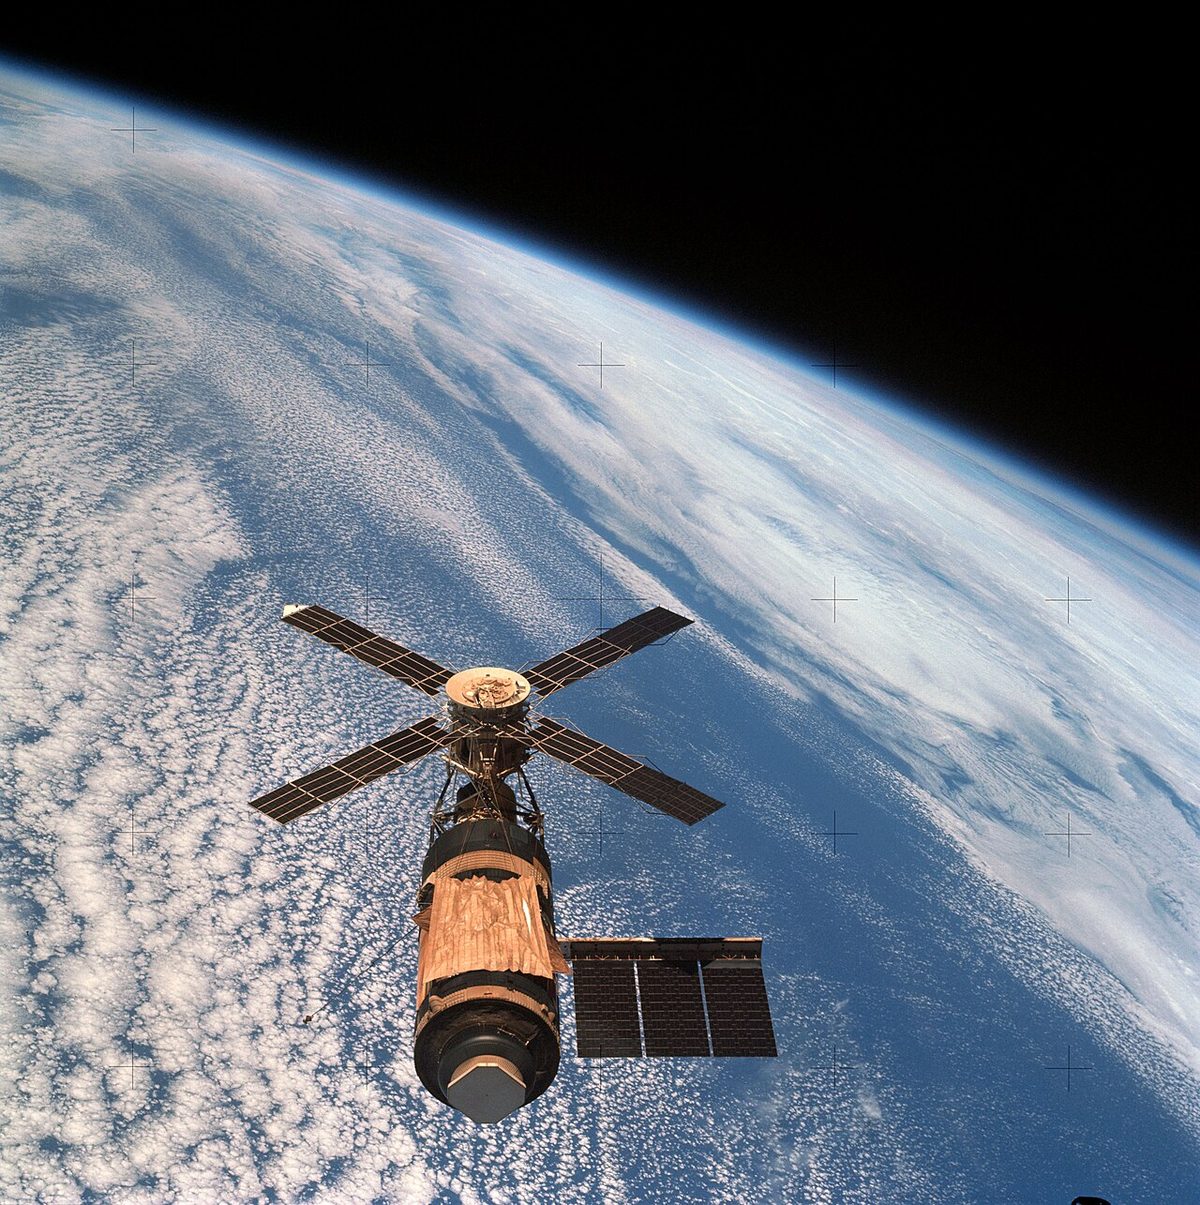
The troposphere is the lowest layer, extending from the surface to the tropopause. Its defining feature is that temperature decreases with height, on average by about 2 °C per 1,000 ft. It holds about three quarters of the mass of the atmosphere and almost all its water vapour, so nearly all cloud and weather forms within it.
Because it is heated from below, the troposphere is continually stirred by convection and turbulence. Its depth depends on how warm the air near the surface is: warm air expands and pushes the top of the layer higher. The troposphere is therefore about 16 to 18 km deep over the equator, about 11 km in mid-latitudes and about 8 km over the poles. Horizontally, tropospheric temperature increases from the poles towards the equator.
The tropopause and stratosphere
The tropopause is the boundary between the troposphere and the stratosphere, where temperature stops falling appreciably with height. In practice it is taken as the lowest level at which the lapse rate falls to 2 °C per km (0.2 °C per 100 m) or less. A climbing crew sees it on the temperature display: the outside air temperature falls steadily, then stops and stays almost constant.
| Region | Average height | Average temperature |
|---|---|---|
| Equator | 16 to 18 km | −75 to −80 °C |
| Around 50° latitude | 11 km (36,090 ft) | −56.5 °C |
| Poles | About 8 km | −40 to −50 °C |
The table holds the point examiners like: the higher the tropopause, the colder it is, because the temperature has kept falling through a deeper troposphere. The tropopause is higher in summer than in winter, and it does not slope smoothly from equator to pole but drops in steps. The main breaks lie near 40° and 60° latitude, and the jet streams lie close to them. On WAFS significant weather charts the tropopause height appears as a flight level in a rectangular box.
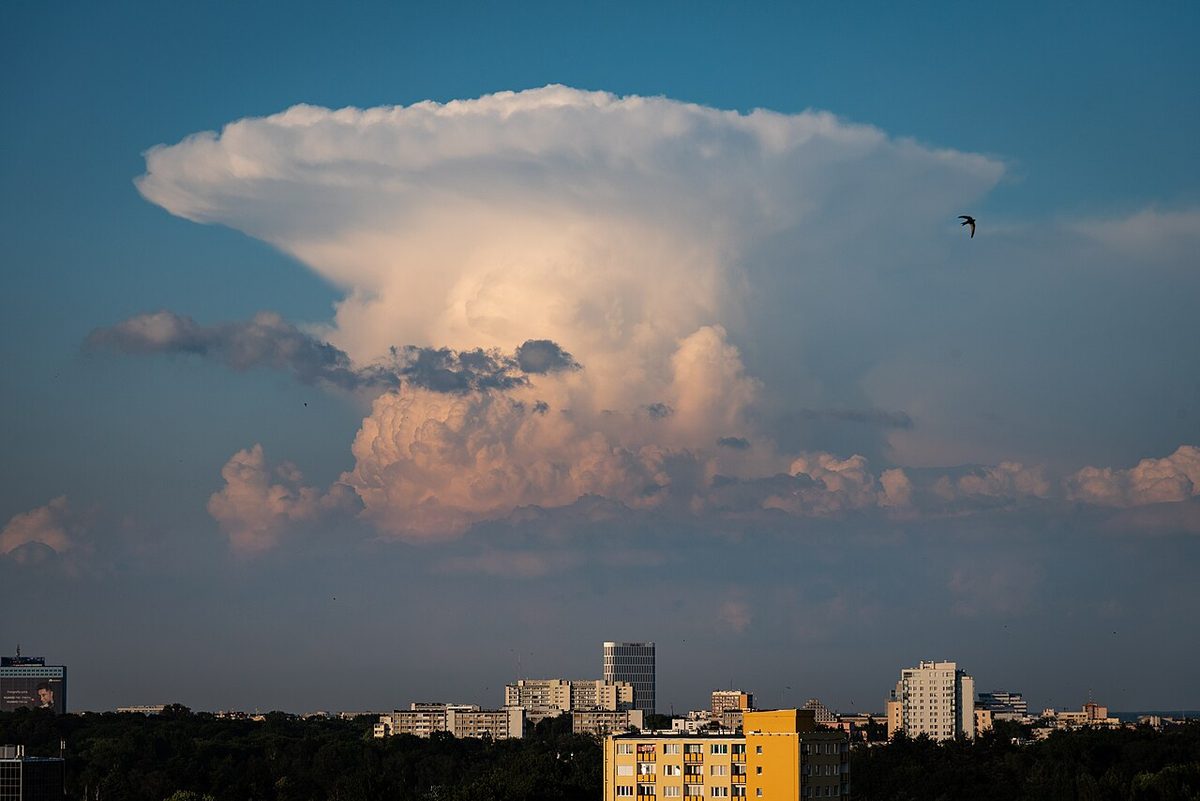
The tropopause usually marks the upper limit of most weather and of significant cloud, the level of the strongest winds, and the zone where clear air turbulence is most common. A cumulonimbus meets it as a lid: the updraught spreads into an anvil, although the strongest tops can overshoot into the lower stratosphere.
The stratosphere extends from the tropopause to about 50 km. Temperature first stays roughly constant with height and then increases, warmed by the ozone absorbing ultraviolet light. Air whose temperature is constant or rising with height is very stable, so vertical motion is suppressed, and the stratosphere is dry and almost free of cloud. Its horizontal temperature pattern differs from the troposphere's: in summer the lower stratosphere is warmer over the poles than over the equator, where the tropopause is high and very cold, and in winter it is warmest in mid-latitudes. Above the stratosphere lie the mesosphere and thermosphere, far above any aeroplane.
The International Standard Atmosphere
Instruments and performance data need a single reference, so ICAO defines the ISA. It is an idealised atmosphere with fixed values:
| ISA parameter | Value |
|---|---|
| Mean sea level temperature | +15 °C (59 °F) |
| Mean sea level pressure | 1013.25 hPa = 29.92 inHg = 760 mm of mercury = 101,325 N/m² |
| Mean sea level density | 1.225 kg/m³ (1,225 g/m³) |
| Lapse rate to 11 km | 0.65 °C per 100 m, 1.98 °C per 1,000 ft (2 °C for mental arithmetic) |
| Tropopause | 11 km (36,090 ft), −56.5 °C |
| 11 to 20 km (36,090 to 65,617 ft) | Constant at −56.5 °C |
| 20 to 32 km | Temperature rises 0.1 °C per 100 m |
The FAA states the same model in its own units: 29.92 inHg and 15 °C at sea level, with pressure falling about 1 inHg and temperature about 2 °C (3.5 °F) per 1,000 ft in the lower atmosphere.
Below the tropopause the ISA temperature is 15 °C minus 2 °C per 1,000 ft: −13 °C at FL140, −1 °C at 8,000 ft. The ISA also fixes the pressure at every height, so each standard pressure level used for upper-air charts has an approximate flight level:
| Pressure level | Approximate ISA flight level |
|---|---|
| 850 hPa | FL050 |
| 700 hPa | FL100 |
| 500 hPa | FL180 |
| 300 hPa | FL300 |
| 250 hPa | FL340 |
| 200 hPa | FL390 |
A flight level is itself a surface of constant pressure: flight level zero is the 1013.2 hPa isobaric surface, and successive levels are 500 ft apart in the standard atmosphere. A chart for the 300 hPa level therefore describes conditions at about FL300, whatever the true height of that surface on the day. The pressure altimeter converts pressure to height with the ISA relationship, which is why every departure of the real air from the model becomes an altimeter error (see altimeter settings, altitude and height).

ISA deviation
ISA deviation is the actual temperature minus the ISA temperature at the same pressure altitude. It is written as ISA +10 or ISA −5, for example, and it is the figure performance charts, cruise tables and density calculations are entered with.
- At 24,000 ft the ISA temperature is 15 − (2 × 24) = −33 °C. An outside air temperature of −35 °C is therefore ISA −2: colder than standard, even though both numbers are negative.
- Above 36,090 ft the ISA temperature remains −56.5 °C. At FL450 it is still −56.5 °C, not the −75 °C that extending the lapse rate would give.
Exam tip: always subtract in the same order, actual minus standard. A negative answer means colder than ISA, a positive one warmer.
A warm deviation lowers air density, so the aeroplane performs as if it were higher. A handy rule is that density altitude rises by about 120 ft for each degree Celsius above ISA: at a 5,000 ft pressure altitude and +30 °C, ISA +25, the aeroplane behaves as though it were at about 8,000 ft. A cold deviation improves performance but makes the altimeter over-read, by about 4 ft per 1,000 ft for each degree below ISA. In jet cruise a large warm deviation reduces the maximum altitude and raises fuel burn.
Air density and the gas laws
Density is mass per unit volume, expressed in kg/m³ or g/m³. Air behaves very nearly as an ideal gas, whose pressure, volume and temperature are linked by the combined gas law, PV/T = constant, or in meteorological form P = ρRT, where ρ is density, R the gas constant for air and T the absolute temperature in kelvin (°C + 273, so ISA sea level is 288 K). Rearranged, density is proportional to pressure and inversely proportional to absolute temperature:
- Raising the pressure compresses the air and increases its density.
- Heating the air makes it expand, which reduces its density.
- Adding water vapour reduces density, because water molecules are lighter than those of nitrogen and oxygen.
As a rough guide, density changes by about 1 per cent for a 3 °C change of temperature or a 10 hPa change of pressure. With height, the fall in pressure outweighs the fall in temperature, so density falls steadily:
| ISA altitude | Density as a share of sea level |
|---|---|
| Mean sea level | 100 per cent |
| 20,000 ft | About 50 per cent |
| 40,000 ft | About 25 per cent |
| 60,000 ft | About 10 per cent |
Density also varies with latitude. At the surface it increases towards the poles, because the air is colder. At about 26,000 ft it is roughly the same at all latitudes, and above that level it decreases towards the poles.
Density drives performance. Lift and drag depend on ½ρV², so in thin air the wing needs the same indicated airspeed but a higher true airspeed, the take-off run lengthens, the climb gradient falls and the maximum take-off mass may be limited. Engines and propellers lose thrust as well. High aerodromes such as Denver and Nairobi, and hot ones such as Bahrain, are the classic cases. Lower density also explains why upper winds are stronger than surface winds: for the same pressure gradient the geostrophic wind is inversely proportional to density, so at 20,000 ft, where density is about half, it is roughly double (see wind forces and geostrophic wind).
Frequently asked questions
What are the ISA values at mean sea level?
The ICAO International Standard Atmosphere assumes a mean sea level temperature of +15 °C, a pressure of 1013.25 hPa, which is 29.92 inHg or 760 mm of mercury, and a density of 1.225 kg/m³. Temperature then falls by 1.98 °C per 1,000 ft, usually rounded to 2 °C, up to the tropopause at 11 km (36,090 ft), where it reaches −56.5 °C.
How high is the tropopause?
In the standard atmosphere the tropopause is at 11 km (36,090 ft). The real one varies with latitude and season. Over the equator it averages about 16 to 18 km at around −75 to −80 °C, near 50° latitude about 11 km at −56.5 °C, and over the poles about 8 km at around −40 to −50 °C. It is higher in summer and above warm air, and the higher it is, the colder it is.
How do you calculate ISA deviation?
ISA deviation is the actual temperature minus the ISA temperature at the same pressure altitude. Below the tropopause the ISA temperature is 15 °C minus 2 °C per 1,000 ft. At 24,000 ft that gives −33 °C, so an outside air temperature of −35 °C is ISA −2. Above 36,090 ft the ISA temperature stays at −56.5 °C, so the lapse rate must not be carried on above it.
What is air made of?
By volume, dry air is about 78 per cent nitrogen, 21 per cent oxygen and 0.9 per cent argon, with carbon dioxide at only a few hundredths of a per cent and traces of other gases. Water vapour comes on top of this and varies from almost nothing to a few per cent. Mixing keeps the proportions of the dry gases constant up to about 60 km; ozone is the exception.
Does humid air have a higher or lower density than dry air?
Humid air is less dense than dry air at the same pressure and temperature. A water molecule is lighter than the nitrogen and oxygen molecules it replaces, so adding water vapour lowers the mass of each cubic metre of air. The effect is smaller than that of temperature or pressure, but on a hot, humid day it adds to the loss of lift and engine power.
Test yourself on The Atmosphere
The v1prep banks cover this topic in Meteorology (050), with a worked explanation for every answer. EASA ATPL, PPL, IR and CPL, the FAA written tests and A320/B737 type ratings.
Start practising →Sources and further reading
- U.S. Standard Atmosphere, 1976 (NOAA, NASA and US Air Force), NASA Technical Reports Server
- FAA Pilot's Handbook of Aeronautical Knowledge (FAA-H-8083-25), Chapter 12, Weather Theory
- FAA-H-8083-28B, Aviation Weather Handbook (chapters on the Earth's atmosphere and temperature)
- SKYbrary, Tropopause
- NOAA JetStream, Layers of the Atmosphere
Library articles are written for study and exam preparation. They do not replace your aircraft's approved documentation, your operator's procedures or the regulations themselves.