Jet Streams
A jet stream is a narrow, fast current of air concentrated along an almost horizontal axis, usually just below the tropopause, with strong vertical and lateral wind shear around its core. The WMO sets its lower speed limit at 30 m/s, about 60 kt.
A jet stream is a narrow, fast current of air concentrated along an almost horizontal axis, usually just below the tropopause, with strong wind shear above, below and on either side of its core. The main jets blow from west to east in both hemispheres and circle the globe in long waves, often broken into separate segments.
For crews at jet cruising levels they matter in two ways. A core of well over 100 kt is a tailwind or headwind that changes flight time and fuel burn, which is why long-haul routes are planned afresh each day from forecast winds. The wind shear around the core is also the main source of clear air turbulence, which gives no warning on weather radar.
What a jet stream is
The World Meteorological Organization (WMO) describes a jet stream as a strong, narrow current along a quasi-horizontal axis in the upper troposphere or the stratosphere, marked by strong vertical and lateral wind shear and containing one or more speed maxima. It sets an arbitrary lower limit of 30 m/s, about 60 kt, for the wind along the axis, and EASA ATPL syllabi use the 60 kt figure. FAA training texts have long used 50 kt instead. Significant weather charts go further and draw only jets of 80 kt or more.
The line of strongest wind is the jet axis, or core. A jet is very much wider than it is deep: the model jet used in EASA training texts is about 2,000 NM long, 200 NM wide and 2 NM (about 12,000 ft) deep, a depth-to-width ratio of 1:100. Real jets vary widely, change strength along their length, and may split, merge or break off. The wind falls away more quickly on the cold, poleward side of the core than on the warm side, so the strongest horizontal shear lies on the cold side.
Exam tip: For EASA exams a jet stream has a core speed of at least 60 kt (30 m/s). FAA material uses 50 kt, and SIGWX charts show only jets of 80 kt or more.
How jet streams form
Upper winds are thermal winds. Pressure falls faster with height in cold air than in warm air, so a horizontal temperature contrast through the troposphere makes the pressure surfaces slope more and more steeply with height, and the wind blowing along them strengthens upward. Because the tropics are warm and the poles cold, the upper wind is westerly in both hemispheres. In the northern hemisphere, with the wind at your back, the cold air and the lower pressure lie on the left; in the southern hemisphere they lie on the right.
The strengthening continues up to the tropopause. Above it the horizontal temperature gradient reverses: the lower stratosphere over high latitudes, where the tropopause is low, is warmer than the air at the same level over the tropics, where the tropopause is high and very cold. The wind therefore peaks just below the tropopause and decreases above it. Where the temperature contrast is squeezed into a narrow zone, such as the polar front, the wind maximum is squeezed too and becomes a jet.
The tropopause itself is not one smooth surface. It lies at about 8 km over the poles and 16 to 18 km over the equator, and between them it drops in steps rather than evenly. The main jets sit near these tropopause breaks, where its height changes abruptly over a short distance.
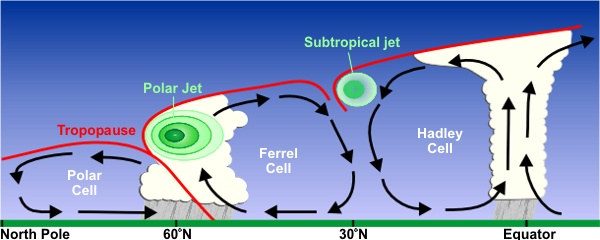
The subtropical jet has a second cause. Air moving poleward in the upper branch of the tropical Hadley circulation keeps its angular momentum about the Earth's axis, so it gains westerly speed relative to the surface as it moves to higher latitudes.
Both main jets are strongest, and furthest from the pole, in winter, when the temperature contrast between equator and pole is greatest. In summer they weaken and move poleward.

Polar front and subtropical jets
The polar front jet stream lies above the polar front, in the warm air over the sloping frontal zone. It usually runs between about 40° and 60° latitude, but it follows the front, so its position changes from day to day as depressions form, swinging poleward over upper ridges and equatorward into troughs. Its core is typically near the 300 to 250 hPa levels, about FL300 to FL340. In a developing frontal depression, EASA training texts place it parallel to the surface fronts in the warm air, roughly 400 NM ahead of the surface warm front and 200 NM behind the surface cold front (see fronts).
The subtropical jet stream lies around 30° latitude, at the poleward edge of the Hadley circulation. Its core is higher, near 200 hPa or about FL390, because the tropopause is higher there, and its position is steadier. It is strong and almost continuous in winter, especially over East Asia, and weaker and broken in summer.
| Polar front jet | Subtropical jet | |
|---|---|---|
| Typical latitude | 40° to 60°, moving with the polar front | About 25° to 35° |
| Core level | About 300 to 250 hPa, FL300 to FL340 | About 200 hPa, FL390 |
| Behaviour | Meanders, changes daily, tied to depressions | Steadier and more west to east |
| Season | Strongest and furthest equatorward in winter | Strong in winter, weak or fragmented in summer |
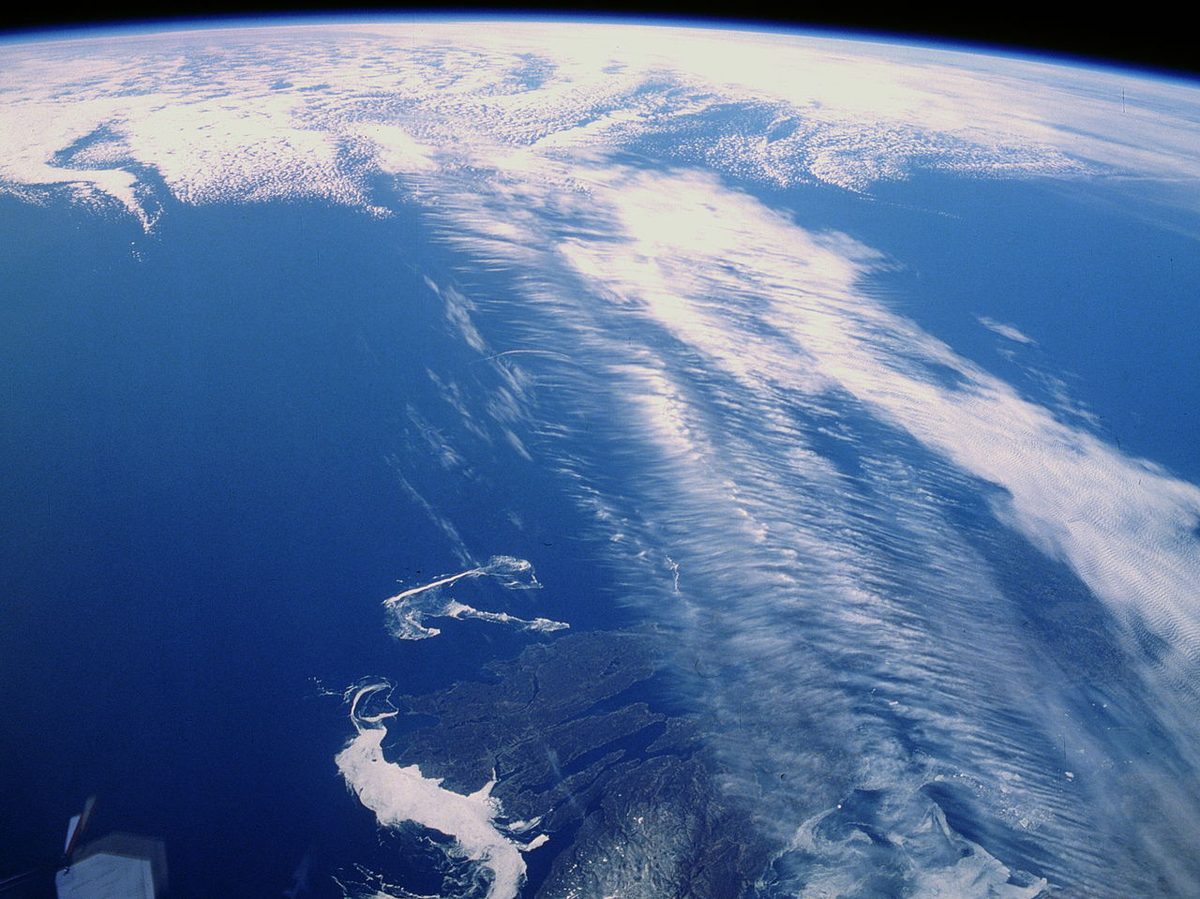
Winter core speeds of 100 to 150 kt are common, and speeds above 200 kt occur, most often over East Asia and where the two jets merge. From the ground a jet can sometimes be recognised by streaks of cirrus moving fast and at right angles to the lower clouds.
Tropical easterly, Arctic and polar night jets
The tropical easterly jet reverses the usual pattern: it blows from the east, in the northern hemisphere summer. It forms in the upper troposphere during the Asian monsoon, driven by the contrast between the heated Asian landmass and Tibetan Plateau and the cooler Indian Ocean to the south. It lies roughly between 10° and 20° N at about 150 to 100 hPa, some 45,000 to 53,000 ft, and stretches from the South China Sea westward across southern India to Africa. The India Meteorological Department gives typical core speeds over the Indian peninsula of 60 to 80 kt.
The Arctic jet stream forms in winter along the Arctic front, between Arctic and polar air. Because the Arctic tropopause is low, the jet is lower than the polar front jet; ATPL training texts put its core near the 400 hPa level. It is transient and appears mainly over North America and northern Eurasia during outbreaks of Arctic air.
The polar night jet is a westerly jet in the stratosphere, around the edge of the cold polar vortex that forms over the winter pole during the polar night, typically near 60° latitude. It extends from roughly 20 km up to 50 km and more, far above any airliner, and ATPL material describes it at the 50 hPa level. It matters to aviation as part of the large-scale circulation, not as a hazard at flight levels.
Low-level jets
A low-level jet is a band of strong wind within the lowest kilometre or two of the atmosphere, far below the jets described so far. The best known is the nocturnal low-level jet. On clear nights over land a surface inversion forms and cuts the air above it off from the friction of the ground. Freed from that drag, the wind above the inversion speeds up, while the wind at the surface falls light or calm. The core usually lies within the lowest kilometre, often around the top of the inversion, so a strong wind can blow only a few hundred feet above a calm runway. Such jets are also frequent over parts of Australia and northern Europe, and similar bands of strong low-level wind blow in the warm air ahead of some cold fronts.
The hazard is low-level windshear. An aircraft descending out of the jet into the calm layer beneath loses its headwind quickly, and with it airspeed and lift; a departing aircraft that climbs into a strong tailwind above the inversion loses airspeed in the same way (see windshear and microbursts). In the United States, non-convective windshear of this kind is forecast in the TAF with a WS group giving the height and the wind at the top of the shear layer (see TAF and trend forecasts).
Isotachs and jets on charts
An isotach is a line joining points of equal wind speed. On upper-air analyses and forecasts for the standard pressure levels, a jet shows up where the isotachs crowd together around an elongated maximum, with the strongest gradient on the cold side. The WAFS wind and temperature forecasts for FL300, FL340 and FL390, which correspond to the 300, 250 and 200 hPa levels, cover the jet levels, and flight planning systems use the same gridded data.
On the WAFS high-level significant weather (SIGWX) chart, which covers FL250 to FL600 (FL630 before November 2024), a jet is drawn as a heavy line with an arrowhead:
- the line starts and ends where the forecast wind reaches 80 kt;
- a wind symbol at each speed maximum gives the speed, with pennants for 50 kt and barbs for 10 kt, and the flight level of the core;
- when the maximum reaches 120 kt, a pair of flight levels shows the jet's depth: the levels of the 80 kt isotach below and above the core;
- double bars across the line mark a change of 20 kt in the core speed;
- areas of forecast clear air turbulence are outlined separately with a dashed line, and tropopause heights appear as flight levels in boxes.
Tropopause folds and turbulence near jets
A tropopause fold is a tongue of stratospheric air, dry, very stable and rich in ozone, drawn down into the troposphere along the sloping frontal zone beneath a jet. It forms when upper-level frontogenesis strengthens the jet, typically in a sharpening upper trough: the tropopause dips steeply below the core and folds back on itself. Folds occur beneath both the polar front and the subtropical jets. They show on water vapour satellite images as dark, dry bands, and forecasters treat them as a sign of likely turbulence. Some ATPL questions use "fold" loosely for the tropopause breaks near the jets; the fold proper is the intrusion of stratospheric air beneath the jet.
The shear around a jet, strongest in these frontal zones and folds, is the main source of clear air turbulence at cruising levels. CAT is most likely:
- on the cold, low-pressure side of the jet, near or just below the core;
- above the core, around the sloping tropopause;
- in sharply curved upper troughs, and where two jets merge or split;
- where the core speed changes rapidly along the axis.
CAT patches are usually shallow but long in the direction of the wind, so a change of level normally escapes them faster than a change of heading. Static air temperature is a useful cue: below the tropopause, a falling temperature in level flight means the aircraft is moving towards the cold side of the jet. Above the tropopause the gradient reverses, so the same cue points the other way. Intensity scales, reporting and technique are covered in turbulence.
Exam tip: CAT near a jet is strongest on the cold (low-pressure) side, near or just below the core, with a secondary area above the core. Expect more of it in a sharp upper trough than over a broad ridge.
Jet streams and flight planning
Because the main jets are westerly, they help eastbound flights and hinder westbound ones. On the North Atlantic, the organised track system is drawn up daily from the forecast winds so that eastbound traffic can ride the jet and westbound traffic can avoid its core. Elsewhere, flight planning systems choose a minimum-time or minimum-cost track from the same forecast winds, and the resulting trip fuel depends heavily on how well the forecast jet matches the real one (see fuel planning and fuel reserves).
Crossing a jet brings rapid changes in wind speed and direction. At high altitude the margin between low-speed and high-speed buffet is narrow, and a sudden change in wind can push the Mach number towards either limit, one more reason to fly the turbulence penetration speed and avoid chasing the airspeed (see high-speed flight). A jet's position can also shift from the forecast. A drift angle, groundspeed or temperature that differs from the flight plan is the first sign, and the crew should re-check fuel and, where turbulence is likely, secure the cabin early.
Frequently asked questions
How high is the jet stream?
Most jet streams lie just below the tropopause. The polar front jet is usually found around FL300 to FL340, near the 300 to 250 hPa levels, and the subtropical jet higher, around FL390 at the 200 hPa level, because the tropopause rises towards the equator. The tropical easterly jet is higher still, around 45,000 to 53,000 ft, while low-level jets blow within the lowest kilometre or so.
How fast does wind have to be to count as a jet stream?
The World Meteorological Organization sets an arbitrary lower limit of 30 m/s, about 60 kt, which is the figure used in EASA ATPL exams. FAA training texts have used 50 kt. Significant weather charts draw a jet only where the wind reaches 80 kt, and give its depth when the core reaches 120 kt. Winter cores of 100 to 150 kt are common.
Why are eastbound flights faster than westbound flights?
The main jet streams blow from west to east in both hemispheres. An aircraft flying east can ride the jet core and gain a tailwind of 100 kt or more, while one flying west meets the same wind as a headwind. Airlines therefore plan routes daily from forecast winds, following the jet eastbound and keeping away from its core, often further north or south, westbound.
Where is turbulence worst near the jet stream?
Clear air turbulence near a jet is most likely on its cold, low-pressure side just below the core, and above the core around the sloping tropopause, where the wind shear is strongest. It is worse in sharply curved upper troughs and where jets merge or split. Weather radar cannot detect it, so crews rely on charts, forecasts and reports from other aircraft, and usually escape by changing level.
What is a low-level jet?
A low-level jet is a band of strong wind in the lowest kilometre or two of the atmosphere. The commonest kind forms on clear nights over land, when a surface inversion cuts the air above it off from ground friction and the wind above the inversion speeds up while the surface wind drops. It causes low-level windshear on approach and departure.
Test yourself on Jet Streams
The v1prep banks cover this topic in Meteorology (050), with a worked explanation for every answer. EASA ATPL, PPL, IR and CPL, the FAA written tests and A320/B737 type ratings.
Start practising →Sources and further reading
- EUMETrain, Clear Air Turbulence, jet stream definition and structure
- FAA AC 00-6A, Aviation Weather, Chapters 13 to 15 (High altitude weather)
- NOAA JetStream, The Jet Stream
- American Meteorological Society, Glossary of Meteorology, polar night jet stream
- India Meteorological Department, Frequently Asked Questions on Monsoon (tropical easterly jet)
- NAV CANADA Aviation Meteorology Reference, Low-Level Jet
- NOAA Aviation Weather Center, High Level SigWx Chart Help
- Flight Safety Foundation, AeroSafety World, Unseen Jets (low-level jets)
Library articles are written for study and exam preparation. They do not replace your aircraft's approved documentation, your operator's procedures or the regulations themselves.