Atmospheric Pressure
Atmospheric pressure is the force per unit area exerted by the weight of the air above a point. Aviation measures it in hectopascals or inches of mercury; it falls with height, varies from place to place and over time, and is the quantity every pressure altimeter measures.
Atmospheric pressure is the force exerted on a unit area by the weight of the column of air above it. At the surface that column reaches to the top of the atmosphere, so the pressure is large, about 1,013 hPa on a standard day; climbing leaves part of the column below, so the pressure falls with height. The pressure acts equally in all directions, which is why an aircraft's static ports can sample it from the side of the fuselage.
Pressure matters to pilots in three ways. The pressure altimeter measures nothing else, so every altitude, height and flight level is a pressure reading converted to feet. Horizontal differences in pressure drive the wind. And the pattern of pressure on a chart, with its depressions, anticyclones, troughs and ridges, is the forecaster's outline of the weather.
Units: hectopascals and inches of mercury
The SI unit of pressure is the pascal (Pa), one newton per square metre. It is a very small unit, so meteorology and ICAO use the hectopascal (hPa), 100 Pa, which is numerically the same as the older millibar (mb). The United States reports pressure in inches of mercury (inHg), the height of a mercury column that the air pressure will support.
| Unit | ISA mean sea level pressure |
|---|---|
| Hectopascals (millibars) | 1013.25 hPa |
| Inches of mercury | 29.92 inHg |
| Millimetres of mercury | 760 mm |
| Pascals (N/m²) | 101,325 Pa |
One inch of mercury is about 33.86 hPa. METARs give QNH in whole hectopascals after the letter Q, so Q0991 is 991 hPa, while US reports use A and hundredths of an inch, so A2989 is 29.89 inHg. QNH and QFE are rounded down to the whole hectopascal, which errs towards the aircraft being higher than indicated. In US METAR remarks, sea-level pressure appears as SLP followed by three figures in tenths of a hectopascal with the leading 9 or 10 omitted: SLP132 is 1013.2 hPa and SLP985 is 998.5 hPa.
Warning: 29.92 inHg and 992 hPa sound alike on the radio but are about 21 hPa apart. Confirm the unit with every altimeter setting received abroad.
Pressure change with height
Pressure falls with height, but not evenly. Air is compressible, so the lower layers are squeezed by the weight above them and hold more mass per foot of depth. Pressure therefore decreases at a decreasing rate as height increases, and the height change for each hectopascal grows as the aircraft climbs.
| ISA altitude | Height per hPa |
|---|---|
| Mean sea level | About 27 ft |
| 20,000 ft | About 50 ft |
| 40,000 ft | About 100 ft |
The 27 ft figure is the one used in exam altimetry calculations; figures from 27 to 30 ft are quoted for the lowest levels. The FAA's working equivalent is about 1 inHg per 1,000 ft. With it, pressure altitude can be estimated from an altimeter setting: at a field elevation of 2,000 ft with 30.42 inHg set, the setting is 0.50 inHg above standard, so the pressure altitude is about 2,000 − 500 = 1,500 ft.
Since pressure is the weight of the air above, roughly half the mass of the atmosphere lies below the 500 hPa level, which is near FL180 in the ISA. Upper-air charts are drawn for such standard pressure levels, and the ISA fixes the approximate flight level of each: 850 hPa near FL050, 700 hPa near FL100, 300 hPa near FL300 and 200 hPa near FL390 (see the atmosphere).
Temperature changes the rate of fall. Cold air is denser, so pressure falls more quickly with height in cold air than in warm air. For the same surface pressure, the pressure at any given height is therefore higher over warm air and lower over cold air. This is the physical cause of the altimeter temperature error, in which an altimeter over-reads in air colder than ISA, and the reason why, aloft, low pressure tends to lie over cold air and high pressure over warm air (see altimeter settings, altitude and height and cold-weather altimetry).
Sea-level pressure (QFF) and isobars
Pressure measured at a station depends on the station's elevation, so readings from a mountain site and a coastal one cannot be compared directly. Each is therefore reduced to mean sea level. The reduction can be done in two ways:
- QNH is the aerodrome pressure reduced to mean sea level using the ISA. It is an altimeter setting: set on the subscale, it makes the altimeter read aerodrome elevation on the ground.
- QFF is the aerodrome pressure reduced to mean sea level using the actual temperature, assuming isothermal conditions between the aerodrome and sea level. It is the meteorologist's value, the one plotted on surface analysis charts.
At an aerodrome at mean sea level, QNH, QFF and QFE are all equal. Above sea level they differ according to temperature. A useful rule: if the aerodrome is above sea level and warmer than ISA, or below sea level and colder than ISA, QNH is greater than QFF; with opposite signs, QFF is greater than QNH. An aerodrome 200 m above sea level and 10 °C colder than ISA therefore has a QFF higher than its QNH.
An isobar is a line joining places of equal pressure, on surface charts usually QFF. Isobars are drawn at a fixed interval stated on the chart: 2 hPa on some charts, 4 hPa or more on large-area charts, and 4 hPa on the US surface analysis, which is issued every 3 hours. Mean sea level pressure normally lies between about 950 and 1050 hPa; the lowest ever recorded, 870 hPa, was in Typhoon Tip in the western Pacific in 1979.
The isobar pattern shows the pressure systems: closed lows (depressions), closed highs (anticyclones), troughs extending from lows, ridges extending from highs, and cols between two highs and two lows. Closely spaced isobars mean a steep pressure gradient and strong wind, and in the northern hemisphere the wind above the friction layer blows along the isobars with low pressure on the left (see pressure systems and wind forces and geostrophic wind). On upper-air charts the equivalent lines are contours or isohypses, which show the height of a constant-pressure surface rather than the pressure at a constant height.
Exam tip: an isobar joins equal pressure, an isallobar equal pressure tendency, an isotherm equal temperature, an isotach equal wind speed and an isohypse equal height of a pressure surface.
Diurnal pressure variation
Even with no weather system moving, surface pressure rises and falls by a small amount each day. The daily cycle of heating sets up an oscillation with a period of 12 hours, not 24, so there are two maxima and two minima a day.
The amplitude is about 1 hPa in temperate latitudes and up to about 3 hPa in the tropics. At a mid-latitude aerodrome it is small beside the changes brought by passing depressions. In the tropics the larger regular swing must be allowed for before a fall in pressure is taken as a sign of a developing system.
Pressure tendency and isallobars
The pressure tendency is the change of pressure at a station over a set period before the observation. Its size and sign are among the most useful clues in a surface observation:
- A steady fall usually means an approaching depression or front. Ahead of a warm front the pressure falls, in the warm sector it falls only slightly, and behind the cold front it rises; in the northern hemisphere the wind veers as each front passes.
- A depression deepens when its central pressure falls and fills when it rises; an anticyclone builds as its pressure rises and weakens or collapses as it falls.
An isallobar is a line joining places of equal pressure tendency. A chart of isallobars shows at a glance where pressure is falling or rising fastest, and so where the pressure pattern is changing.
In United States METARs the remark PRESFR means pressure falling rapidly and PRESRR pressure rising rapidly, defined as a change of at least 0.06 inHg per hour. For the pilot, a falling barometer has a direct altimetry consequence. Flying at a constant indicated altitude from high pressure towards low pressure, without resetting the subscale, the aircraft follows the sloping pressure surfaces downwards while the altimeter shows no change: "from high to low, look out below". A setting that has gone stale because the pressure at the aerodrome is falling has the same effect, so on an arrival with PRESFR reported the crew should ask the tower for the current value.
Measuring pressure: barometers and barographs
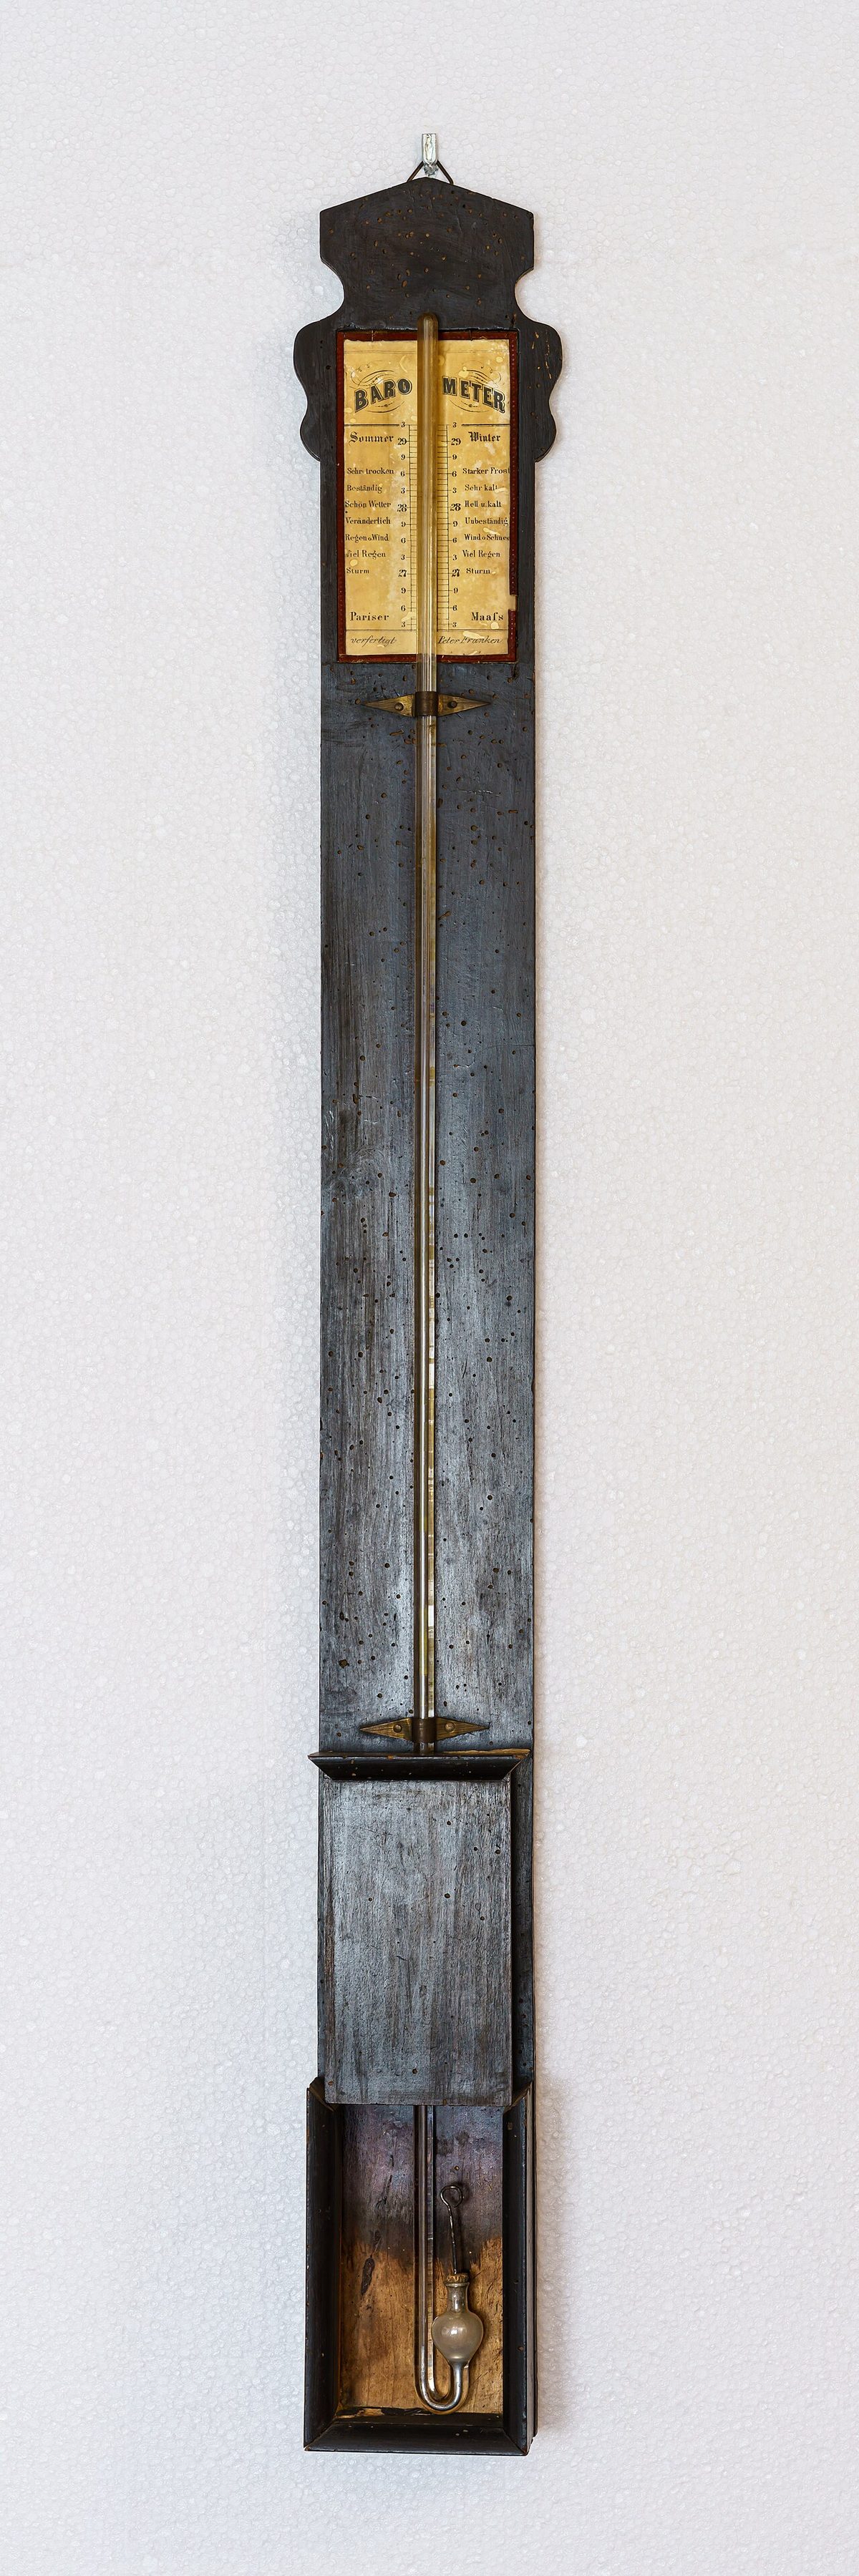
A barometer measures atmospheric pressure. Two classic types are still taught:
- The mercury barometer balances the air pressure against a column of mercury in a glass tube sealed at the top. The height of the column, 760 mm or 29.92 in at standard pressure, is the origin of the inches and millimetres of mercury still used as units.
- The aneroid barometer uses a sealed metal capsule, partly evacuated, whose thin corrugated walls flex as the outside pressure changes. Levers or an electronic pick-off convert the movement to a reading. It is the principle of the pressure altimeter, which is an aneroid barometer calibrated in feet according to the ISA.
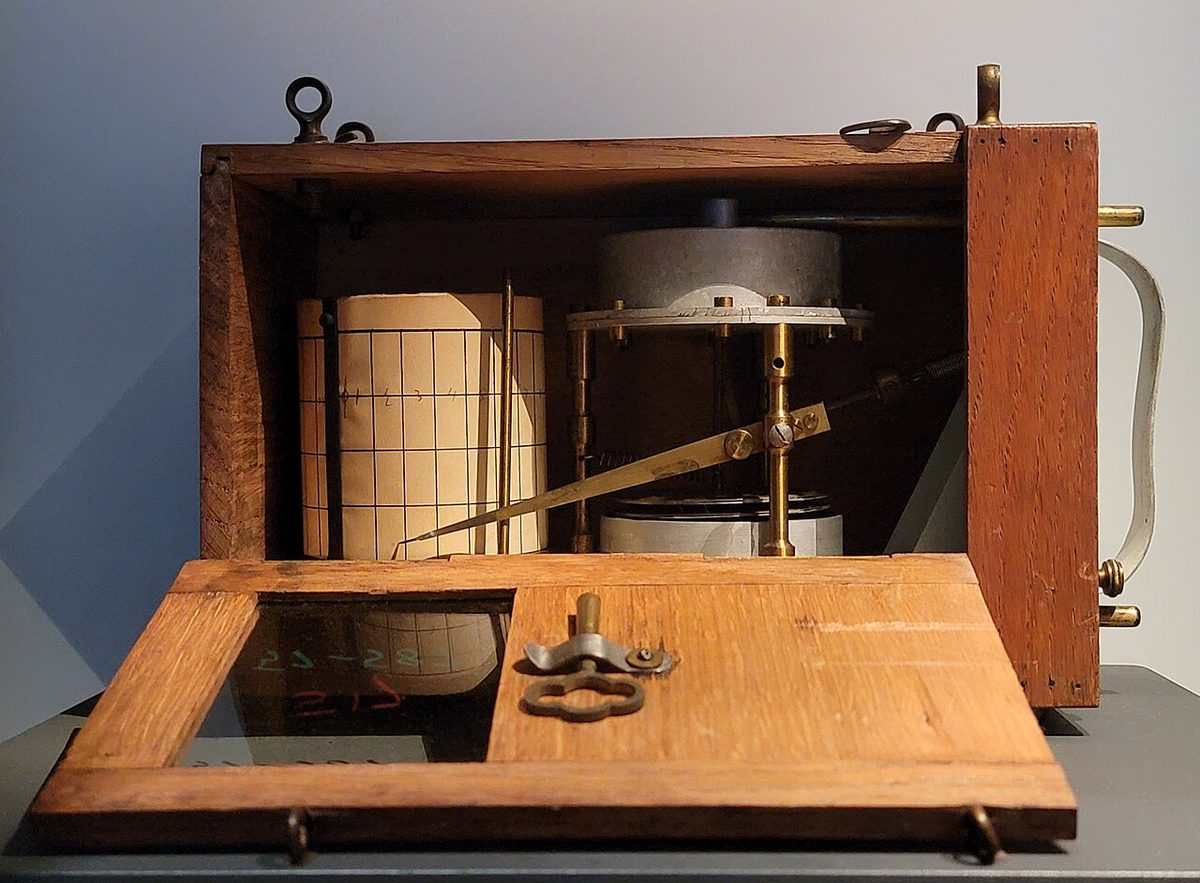
A barograph is a recording barometer: an aneroid unit drives a pen across a paper chart on a slowly rotating drum, giving a continuous record of pressure from which the tendency can be read directly.
Meteorological stations measure station pressure with precision instruments and compute from it the QFE, QNH and QFF they report. Pressure aloft is measured by the radiosonde, a balloon-borne instrument package that reports pressure, temperature and humidity as it climbs, with the main ascents at 0000 and 1200 UTC. In the aircraft the same quantity arrives through the static system, where the altimeter, the vertical speed indicator and the air data computer all depend on it (see pitot-static system).
Frequently asked questions
What is standard atmospheric pressure in hPa and inHg?
Standard mean sea level pressure in the ICAO Standard Atmosphere is 1013.25 hPa, which equals 29.92 inches of mercury, 760 mm of mercury or 101,325 pascals. One hectopascal is the same as one millibar, and one inch of mercury is about 33.86 hPa. The value set as the standard pressure setting on an altimeter subscale is 1013 hPa or 29.92 inHg.
How many feet is one hectopascal?
Near mean sea level one hectopascal of pressure corresponds to about 27 ft of height in the standard atmosphere, the figure used in exam altimetry calculations. Because pressure falls more slowly as the air thins, the figure grows with height, to about 50 ft per hPa at 20,000 ft and about 100 ft per hPa at 40,000 ft. The FAA rule of thumb is about 1,000 ft per inch of mercury.
What is the difference between QNH and QFF?
Both reduce the pressure measured at an aerodrome to mean sea level. QNH does it using the standard atmosphere, so an altimeter set to it reads aerodrome elevation. QFF uses the actual temperature, which gives a truer sea-level pressure for weather analysis, and isobars on surface charts are drawn from it. At a sea-level aerodrome the two are equal; elsewhere they differ with temperature.
What does PRESFR mean in a METAR?
PRESFR is a remark used in United States METARs meaning pressure falling rapidly; PRESRR means pressure rising rapidly. The FAA defines a rapid change as at least 0.06 inHg per hour. A rapidly falling pressure usually means an approaching low or front, and it warns that the altimeter setting in the ATIS may already be too high, which would put the aircraft lower than indicated.
What is diurnal pressure variation?
Diurnal pressure variation is a small, regular rise and fall of surface pressure with a period of 12 hours rather than 24, maintained by the daily cycle of heating, so there are two maxima and two minima each day. It amounts to about 1 hPa in temperate latitudes and up to about 3 hPa in the tropics. It must be allowed for before a pressure change is read as a weather change.
Test yourself on Atmospheric Pressure
The v1prep banks cover this topic in Meteorology (050), with a worked explanation for every answer. EASA ATPL, PPL, IR and CPL, the FAA written tests and A320/B737 type ratings.
Start practising →Sources and further reading
- FAA Pilot's Handbook of Aeronautical Knowledge (FAA-H-8083-25), Chapter 12, Weather Theory (atmospheric pressure and its measurement)
- FAA-H-8083-28B, Aviation Weather Handbook (atmospheric pressure, surface analysis charts)
- Federal Meteorological Handbook No. 1 (FMH-1), Surface Weather Observations and Reports (2019)
- WMO-No. 782, Aerodrome Reports and Forecasts, A Users' Handbook to the Codes
- FAA Aeronautical Information Manual, Chapter 7 Section 2, Barometric Altimeter Errors and Setting Procedures
- NOAA JetStream, Air Pressure
Library articles are written for study and exam preparation. They do not replace your aircraft's approved documentation, your operator's procedures or the regulations themselves.