Drag
Drag is the component of the total aerodynamic force that acts parallel to the relative airflow, resisting the aircraft's motion through the air. It is divided into parasite drag, which rises with the square of the speed, and induced drag, the by-product of lift, which falls as the speed rises.
Drag is the aerodynamic force that resists an aircraft's motion through the air. It acts parallel to the relative airflow and in the same direction as it, which is opposite to the flight path, and in steady level flight the engines must supply a thrust equal to it. In the cruise, drag therefore sets the thrust required and with it the fuel burn, and the glide of an aeroplane without power is fixed by how much drag it makes for each unit of lift.
Drag comes in two families that behave in opposite ways. Parasite drag is the cost of moving any body through a viscous fluid and grows with the square of the speed. Induced drag is the cost of producing lift and falls as the speed rises. Their sum gives the U-shaped total drag curve, and the bottom of that curve, the minimum drag speed VMD, is one of the most useful reference speeds in aircraft performance.
What drag is
The total reaction on a wing or a whole aircraft is resolved into two components: lift, perpendicular to the relative airflow, and drag, parallel to it. Neither is referenced to the chord line, the fuselage axis or the horizon. Drag follows the same general equation as every aerodynamic force:
D = ½ρV² × S × CD
where ½ρV² is the dynamic pressure, S the wing area and CD the drag coefficient. Using the wing area as the reference for the whole aircraft keeps lift and drag coefficients directly comparable.
EASA and FAA material divide drag in the same way, into parasite and induced drag:
- Parasite drag, also called zero-lift drag, is all drag not associated with producing lift. It is made up of skin friction drag, form (pressure) drag and interference drag.
- Profile drag is the name for skin friction and form drag taken together.
- Induced drag is the by-product of lift and exists only while the wing is lifting. At the zero-lift angle of attack it vanishes and only parasite drag remains.
Above the critical Mach number, shock waves add wave drag, covered in high-speed flight.
Exam tip: profile drag = skin friction + form drag; parasite drag = profile drag + interference drag; total drag = parasite drag + induced drag. Induced drag is never a component of parasite drag.
Parasite drag: skin friction, form and interference
Skin friction drag comes from the viscosity of the air. The air in contact with the skin is carried along with it, and within the thin boundary layer the speed rises from zero at the surface to the free-stream value. The shear stress in that layer, acting over the whole wetted area (the total surface in contact with the airflow), is the skin friction. It depends on the size of the wetted area, the smoothness of the surface, and whether the boundary layer is laminar, which gives little friction, or turbulent, which gives much more. Anything that moves the transition from laminar to turbulent flow forward increases it. That is why airframe ageing, with its scratches, repairs, dirt and grease, gradually raises drag and fuel consumption. FAA AC 20-117 notes that frost, ice or snow with the roughness of medium or coarse sandpaper on the leading edge and upper surface can increase drag by 40 % and reduce lift by as much as 30 %.
Form drag, or pressure drag, comes from the pressure difference between the front and the rear of a body. At the leading-edge stagnation point the air is brought to rest and its pressure is at a maximum; behind the body, and especially in any separated wake, the pressure is lower. The imbalance pushes the body rearwards. A flat plate facing the airflow produces almost nothing but form drag; the same plate edge-on produces almost nothing but skin friction. Extended landing gear, flaps, speed brakes and the external bumps of antennas and lights all add form drag.
Interference drag arises where two parts meet, such as the wing and fuselage, an engine nacelle and its pylon, or a strut and the wing. The boundary layers and pressure fields of the two parts interact, the flow in the corner is slowed and disturbed, and the combination makes more drag than the parts would separately. Fillets and fairings that smooth the junctions reduce it.
Profile drag and streamlining
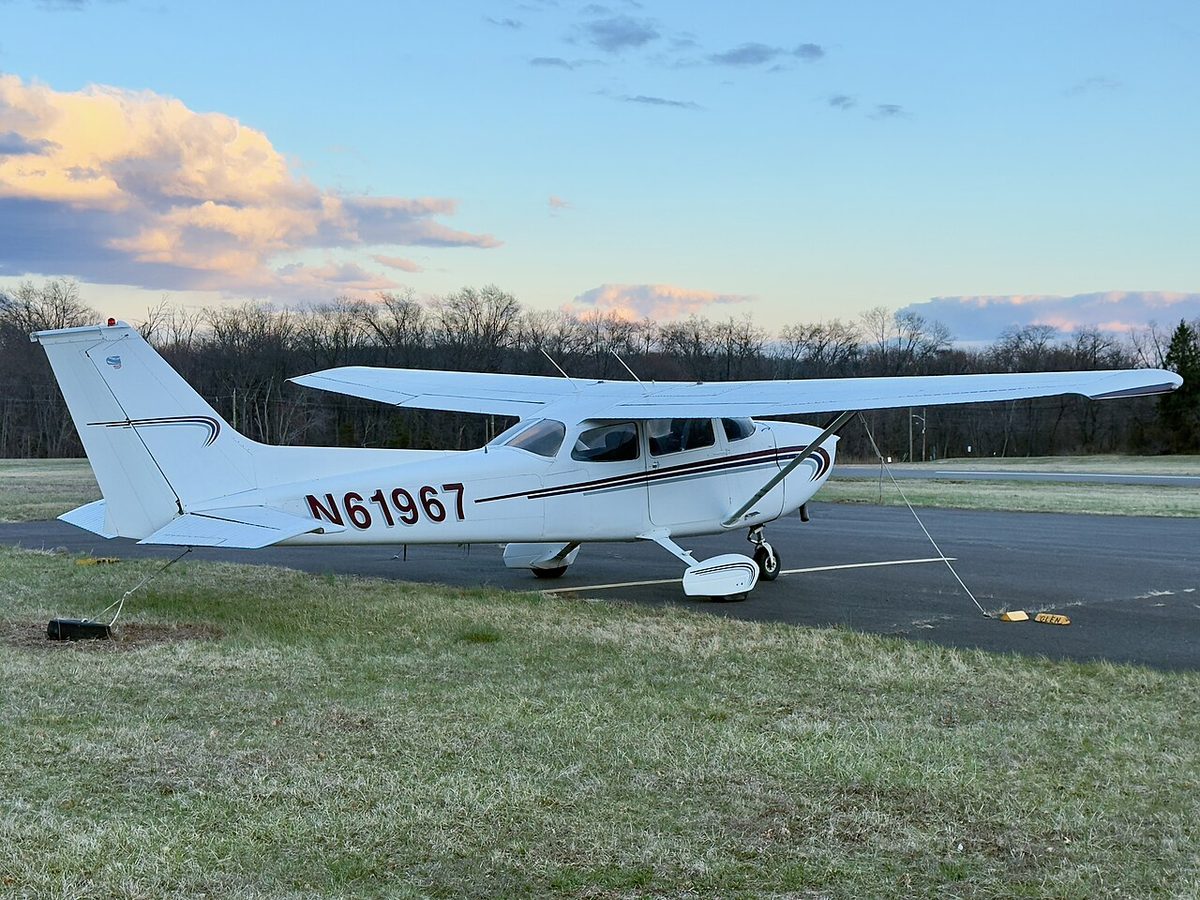
Profile drag is the drag that an aerofoil section or body produces because of its surface and its shape. The designer's tool against it is streamlining: shaping a body, usually with a rounded nose and a long, gently tapering tail, so that the flow stays attached and the pressure recovers towards the rear instead of collapsing into a wide wake.
Streamlining involves a trade-off. Lengthening a body reduces the pressure gradient between its front and back and discourages separation, so form drag falls, but the longer body has more wetted area, so skin friction rises. The best shape is the one that gives the lowest total profile drag, not the lowest form drag. A fairing is a streamlined cover fitted over an irregular part, such as a wheel, a flap track or an aerial, to turn a bluff shape into a smoother one.
Induced drag versus parasite drag
Induced drag has a different cause. A lifting wing has higher pressure beneath it than above, so air spills round the tips into trailing vortices. They induce a downwash over the wing, which tilts the lift rearwards; the rearward component is induced drag. Its coefficient is CDi = CL² ÷ (π × aspect ratio), so it grows with the square of the lift coefficient and falls as the wing becomes more slender. The mechanism is covered in induced drag and wingtip vortices.
The two families respond oppositely to speed. In the simple model used for performance, parasite drag depends only on dynamic pressure, so it varies with V². Induced drag varies with 1/V², because at high speed the wing needs only a small lift coefficient to support the weight. In level flight at constant weight:
| Change | Parasite drag | Induced drag |
|---|---|---|
| Speed doubled | four times as much | a quarter |
| Speed halved | a quarter | four times as much |
| Weight 10 % higher, same IAS | unchanged | about 21 % more (it varies with weight²) |
| Climb at constant IAS | unchanged | unchanged |
| Climb at constant TAS | falls | rises |
Induced drag therefore dominates at low speed, in the take-off, the initial climb and the approach, while parasite drag dominates at high speed. The tailplane adds trim drag: its download must be carried by extra wing lift, with extra induced drag, and a forward centre of gravity increases it.
Drag coefficient
The drag coefficient (CD) is drag per unit wing area divided by dynamic pressure: CD = D ÷ (½ρV²S). Like CL, it is dimensionless, and at low speed it depends essentially on the shape of the aircraft and its angle of attack. It is conveniently split into two parts:
CD = CD0 + CDi
CD0 is the zero-lift (parasite) drag coefficient and CDi = CL² ÷ (π × aspect ratio) the induced drag coefficient. The formula gives the ideal value for an elliptical lift distribution; real wings produce somewhat more, which designers express with an efficiency factor.
Plotted against angle of attack, CD is lowest near zero lift and rises throughout the range. Unlike CL, it has no peak at the stall: induced drag keeps growing with CL², and the widening separated wake adds pressure drag, so CD climbs steeply through and beyond the stalling angle. At high Mach numbers CD also depends on Mach number, rising sharply at the drag divergence Mach number, which is always above the critical Mach number.
The total drag curve
The drag curve plots drag against airspeed. Drawn separately, the parasite drag curve rises steeply to the right and the induced drag curve falls away from the left. Added together they give the total drag curve, U-shaped with a single low point. That point is the minimum drag speed, VMD. At VMD induced drag equals parasite drag, total drag is at its minimum and the lift/drag ratio is at its maximum.

Speed stability. Above VMD, on the front of the curve, a loss of speed reduces drag, so with the thrust unchanged the aeroplane accelerates back towards its trimmed speed; a gain in speed increases drag and slows it again. The aeroplane is speed stable. Below VMD, on the back of the curve, a loss of speed increases drag, which at constant thrust slows the aeroplane further: it is speed unstable, and only more thrust or a lower nose attitude stops the divergence. For a propeller aeroplane, whose engine gives roughly constant power rather than constant thrust, the dividing line is the minimum power speed on the power-required curve. FAA material calls speeds below it the region of reversed command, where flying slower needs more power (see power curves and speed stability).
Weight. More weight means more induced drag at every speed, so the curve moves up and VMD moves to a higher speed, in proportion to the square root of the weight. Because the maximum lift/drag ratio does not change with weight, the minimum drag itself rises in direct proportion to weight: minimum drag = weight ÷ (L/D)max.
Altitude. Plotted against indicated airspeed, the curve hardly changes with altitude: at the same IAS the dynamic pressure, the lift coefficient and both drag components are the same. VMD is therefore a fixed IAS for a given weight, reached at a higher true airspeed as the aircraft climbs, until compressibility intervenes at high Mach numbers.
Configuration. Flaps, landing gear and speed brakes add parasite drag. The whole curve moves up, VMD moves to a lower speed and the maximum lift/drag ratio falls. Because VMD falls, a given approach speed lies further above it, and EASA training material treats the extra drag of flaps, gear or speed brakes as improving speed stability on the approach.
Drag polar and maximum L/D
The drag polar is a plot of CL against CD for a wing or a complete aircraft, each point corresponding to one angle of attack. A straight line from the origin that just touches the polar picks out the point where CL/CD is greatest: the maximum lift-to-drag ratio, (L/D)max. For the idealised polar CD = CD0 + k × CL², that point is where the zero-lift and induced drag coefficients are equal, the same condition that defines VMD. On a modern wing (L/D)max occurs at an angle of attack of about 4°, well below the stalling angle.
The drag curve also fixes the speeds pilots use for endurance, range and the glide. The table gives the classic still-air results.
| Speed | Where it sits | What it gives |
|---|---|---|
| VMP, about 0.76 VMD | Minimum power required | Maximum endurance for a propeller aeroplane; minimum rate of sink in a glide |
| VMD | Minimum drag, (L/D)max | Best glide range; maximum endurance for a jet; maximum range for a propeller aeroplane |
| About 1.32 VMD | Tangent from the origin to the drag curve | Maximum range for a jet |
The glide follows directly. In a steady glide the glide ratio equals the lift/drag ratio, so the still-air distance is height × L/D. With an (L/D)max of 12, a glide from 5,000 ft covers 60,000 ft, almost 10 NM. Weight does not change (L/D)max, so a heavy aeroplane glides the same distance as a light one, but at the higher speed its weight requires and with a higher rate of descent. Into a headwind the ground distance is increased by flying slightly faster than VMD. Extending flap lowers (L/D)max and steepens the glide.
Transport aircraft display the result to the crew. On the Airbus A320 the green dot on the speed scale is the engine-out operating speed in clean configuration, the best lift/drag speed, computed from weight and altitude; with no other limit it is also close to the maximum endurance speed used as the default holding speed. See also range, endurance and gliding.
Frequently asked questions
What are the main types of drag on an aircraft?
Total drag is divided into parasite drag and induced drag. Parasite drag, also called zero-lift drag, is all the drag not caused by producing lift, and it is made up of skin friction drag, form (pressure) drag and interference drag. Induced drag is the by-product of lift, caused by the wingtip vortices and the downwash they create. At high Mach numbers a third element, wave drag from shock waves, appears as well.
Why does induced drag decrease as airspeed increases?
In level flight the wing must always produce lift equal to the weight. At high speed the dynamic pressure is large, so the wing needs only a small angle of attack and a small lift coefficient, which means weaker tip vortices and less downwash. Induced drag varies inversely with the square of the speed, so doubling the speed cuts it to a quarter, while parasite drag rises to four times its value.
What is the minimum drag speed VMD?
VMD is the speed at the bottom of the total drag curve, where induced drag and parasite drag are equal and their sum is at its minimum. It is also the speed of the maximum lift/drag ratio, so it gives the best still-air glide range, the best endurance for a jet and the best range for a propeller aeroplane. As an indicated airspeed it rises with the square root of the weight but does not change with altitude.
What is the difference between profile drag and parasite drag?
Profile drag is the sum of skin friction drag and form drag, the drag an aerofoil section or body produces because of its surface and its shape. Parasite drag adds interference drag, created where parts of the aircraft meet, to profile drag. Parasite drag is therefore the larger family, and induced drag belongs to neither. FAA material likewise splits parasite drag into form, skin friction and interference drag.
What is the back of the drag curve?
The back of the drag curve is the range of speeds below VMD. There, a loss of speed increases drag, because induced drag rises faster than parasite drag falls, so with the thrust unchanged the aeroplane keeps slowing unless the pilot adds thrust. It is speed unstable. Above VMD a loss of speed reduces drag and the aeroplane tends to return to its trimmed speed. A slow approach, such as a short-field approach, can put the aeroplane on the back of the curve.
Test yourself on Drag
The v1prep banks cover this topic in Principles of Flight (081), with a worked explanation for every answer. EASA ATPL, PPL, IR and CPL, the FAA written tests and A320/B737 type ratings.
Start practising →Sources and further reading
- FAA Pilot's Handbook of Aeronautical Knowledge (FAA-H-8083-25), Chapter 5, Aerodynamics of Flight
- FAA Airplane Flying Handbook (FAA-H-8083-3C)
- EASA, Explanatory Note to ED Decision 2018/001/R, Part-FCL theoretical knowledge learning objectives
- NASA Glenn Research Center, The Drag Equation
- NASA Glenn Research Center, Lift to Drag Ratio
- FAA AC 20-117, Hazards Following Ground Deicing and Ground Operations in Conditions Conducive to Aircraft Icing
Library articles are written for study and exam preparation. They do not replace your aircraft's approved documentation, your operator's procedures or the regulations themselves.