Lift
Lift is the component of the total aerodynamic force on a wing that acts perpendicular to the relative airflow. The wing produces it by turning the airflow downwards, which leaves lower pressure above the wing than below, and its size is given by L = ½ρV²SCL.
Lift is the part of the aerodynamic force on a wing that acts at right angles to the relative airflow. It holds an aeroplane up in level flight, turns it in a bank and pulls it out of a dive. Its limit, the maximum lift coefficient, sets the stalling speed and, through it, most of the speeds a pilot flies.
A wing makes lift by deflecting the air that flows past it downwards, and in doing so leaves the pressure over its upper surface lower than the pressure beneath. The amount depends on the air density, the square of the speed, the wing area and a lift coefficient that the pilot controls through the angle of attack. The popular story that the upper-surface air must speed up to rejoin the lower-surface air at the trailing edge is wrong, and neither pilots nor examiners need it.
How a wing produces lift
A wing with camber, or set at a positive angle of attack (the angle between its chord line and the relative airflow), disturbs the flow well ahead of itself. Air approaching the leading edge is drawn upwards towards the low pressure above it, the upwash. It follows the curved upper surface and leaves the sharp trailing edge moving downwards, the downwash. Over the upper surface the streamlines crowd together, so the air accelerates and its static pressure falls; beneath, the flow slows slightly and its pressure rises. The pressure difference acting over the wing is the lift.
Two sets of laws describe this one flow from different sides, and neither is a separate source of lift:
- Bernoulli's theorem: in the steady flow of an ideal fluid, static pressure plus dynamic pressure is constant along a streamline, p + ½ρV² = constant, so where the flow speeds up its pressure falls. Combined with the principle of continuity, by which a narrowing streamtube accelerates the flow, this is the explanation EASA exam material uses.
- Newton's laws: each second the wing gives a mass of air a downward momentum, so the air pushes the wing up with an equal and opposite force. The pressure field is how that push reaches the wing's surface.
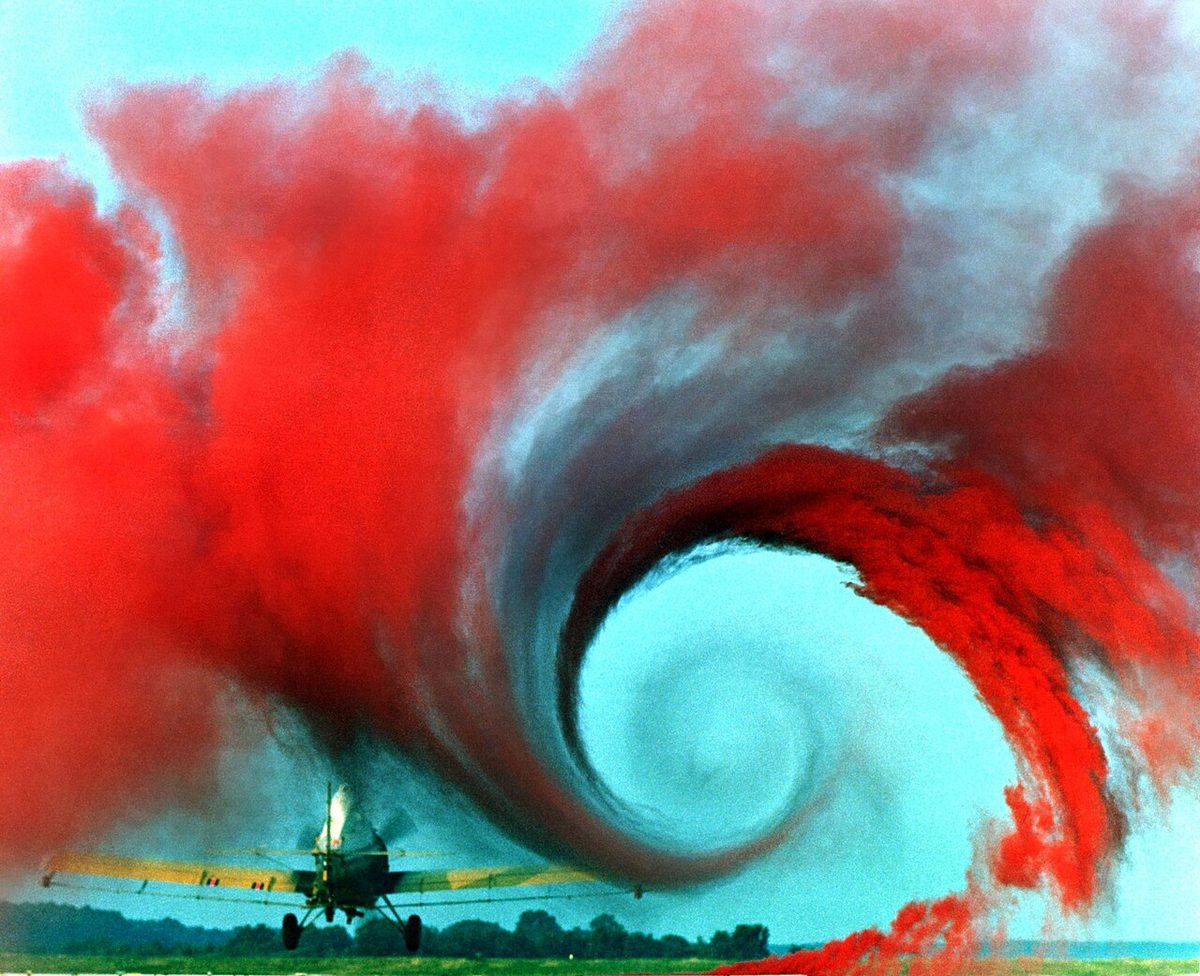
Aerodynamicists describe the flow as a uniform stream plus a circulation around the wing. The sharp trailing edge fixes its strength, because the flow must leave the trailing edge smoothly rather than whip around it (the Kutta condition), and lift per unit span is proportional to air density, speed and circulation. The circulation does not end at the wing tips: it trails behind as the tip vortices (see wake turbulence).
The equal transit time fallacy
A long-lived explanation claims that air over the longer upper surface must travel faster so that it meets the air from the lower surface at the trailing edge at the same moment. Nothing requires the two to meet. Wind tunnel smoke pulses show the upper-surface air reaching the trailing edge well before the air that went underneath, and the real speed-up is far greater than the difference in path length would give. The idea also cannot explain lift from a symmetrical aerofoil, a flat plate or an aeroplane flying inverted, where the path lengths are equal or reversed. The FAA's Pilot's Handbook of Aeronautical Knowledge explains lift through Bernoulli's principle and Newton's third law together and does not use it.
Exam tip: EASA questions expect faster flow and lower static pressure over the upper surface (continuity and Bernoulli), the upper surface as the largest contributor, and lift acting perpendicular to the relative airflow. FAA questions expect Bernoulli and Newton together. Any option saying the two airflows must meet at the trailing edge is wrong.
Pressure distribution and suction peak
The pressure distribution is the pattern of static pressure over the aerofoil surface. Near the leading edge the flow divides at the stagnation point, where it comes to rest relative to the wing and the static pressure reaches its maximum, equal to total pressure. As the angle of attack increases from about −4°, the stagnation point moves from the upper surface around the leading edge to the underside.
Over the upper surface the flow accelerates round the leading edge to the point of lowest pressure a short distance behind it, the suction peak. It then slows as it travels aft against rising pressure towards the trailing edge, the adverse pressure gradient. Raising the angle of attack strengthens the suction peak, moves it forward and steepens the adverse gradient. Upper-surface suction supplies most of the lift, about 80 per cent in the figure EASA exam texts quote. That is why frost, ice or dirt near the leading edge, spoiling the acceleration there, cost so much lift.
Near the stall the boundary layer can no longer climb the adverse gradient. Separation starts at the trailing edge and creeps forward until the suction peak collapses (see stall).
The lift equation
L = ½ρV² × S × CL
Here ρ is the air density, V the true airspeed, S the wing's plan area (including the part covered by the fuselage and nacelles) and CL the lift coefficient. The term ½ρV² is the dynamic pressure, the quantity the airspeed indicator measures. The equation explains most of what pilots see:
- Speed. At a constant angle of attack, lift varies with the square of the speed: doubling the speed quadruples the lift. In level flight each indicated airspeed at a given weight needs its own angle of attack, lower when faster.
- Altitude. The same indicated airspeed means the same dynamic pressure, and so the same angle of attack, at any altitude; only the true airspeed rises. At 40,000 ft, where density is about a quarter of its sea-level value, true airspeed must double for the same lift.
- Flight path. In level flight lift equals weight: a 60,000 kg aeroplane needs 60,000 × 9.81 = 588,600 N. In a steady climb or descent lift is weight × cos(flight path angle), slightly less than weight. In a level turn it is weight ÷ cos(bank): twice the weight at 60°.
- Stall speed. Setting CL to its maximum gives VS = √(2W ÷ (ρ × S × CLmax)), so stall speed varies with the square root of weight: 10 per cent more mass raises it by about 5 per cent. Take-off and approach speeds are fixed as multiples of it (see take-off speeds).
Lift coefficient and the lift curve
An aerodynamic force coefficient is a force per unit area divided by dynamic pressure. It is dimensionless and, at low speed, depends mainly on the shape of the surface and its angle of attack, since those two set the pressure distribution. The lift coefficient (CL), also called the coefficient of lift (CL), is therefore CL = L ÷ (½ρV²S). It lets one curve describe a wing at any speed, density or size.
The lift curve plots CL against angle of attack. Over the normal range it is almost straight, rising at a constant lift curve slope, the increase in CL per degree. As trailing-edge separation spreads, the curve bends over, peaks at CLmax and then falls, while the drag coefficient keeps rising. The best lift/drag ratio of a typical modern wing comes at about 4°, far below the stall.
Planform and Mach number change the curve. A swept wing has a shallower slope and stalls at a higher angle, so swept-wing jets fly nose-high on final. Above about M 0.4 compressibility lowers CLmax and the stalling angle, which is why the 1 g stall speed, as equivalent airspeed, rises at high altitude (see high-speed flight).
CLmax and the zero-lift angle of attack
The maximum lift coefficient (CLmax) is the highest CL a wing reaches in a given configuration. It occurs at the critical angle of attack, about 16° for a typical section in exam texts, and it fixes the lowest speed at which a given weight can be supported. The angle is a property of the wing and its configuration: weight, bank and altitude change the speed at which it is reached, not the angle. CLmax depends on the section's camber, leading-edge shape and thickness, on the surface condition and on the configuration.
The zero-lift angle of attack is the angle at which CL is zero. A symmetrical section produces no lift at 0°. A positively cambered section still lifts at small negative angles and reaches zero lift at a small negative angle, typically about −4°, so camber moves the whole curve up and to the left.
High-lift devices work on both. A trailing-edge flap adds camber: CLmax rises, the zero-lift angle becomes more negative and the stalling angle falls, which is why the nose sits lower on a flapped approach. A leading-edge slat re-energises the boundary layer and extends the curve to a higher stalling angle, up to about 25° against about 16° for the basic section, raising CLmax too. Ice and frost lower both CLmax and the stalling angle.

Centre of pressure and aerodynamic centre
The centre of pressure (CP), center of pressure in FAA spelling, is the point on the chord line through which the resultant lift is taken to act. On a cambered section it moves forward as the angle of attack increases, reaching its most forward position just before the stall, then moves sharply aft as the suction peak collapses; this is one reason a stalling aeroplane pitches nose-down. On a symmetrical section it hardly moves over the normal range. Lowering flap moves it aft, and through the transonic range it moves aft towards about 50 per cent of the chord, one cause of Mach tuck.
Because the CP wanders, it is a poor reference for stability. The aerodynamic centre (AC) is the point about which the pitching moment does not change with angle of attack, and where changes in lift can be taken to act. Below about M 0.4 it lies at about 25 per cent of the chord for any section, whatever its camber or thickness. As lift increases the CP moves towards the AC, shortening the lever arm, so the moment about the AC stays constant. For the whole aeroplane the equivalent point is the neutral point, which with the centre of gravity sets the static margin.
Pitching moment
A pitching moment is a moment about the lateral axis, conventionally positive nose-up. It is written with the pitching moment coefficient (Cm) as M = Cm × ½ρV² × S × c, where c is the mean aerodynamic chord. About its aerodynamic centre a symmetrical section has no pitching moment and a positively cambered section a constant nose-down one; aft-loaded supercritical sections have a larger nose-down moment that costs some trim drag.
On the aeroplane, lift acting behind the CG forms a nose-down couple with the weight, which the tailplane balances with a download. On many light aeroplanes a thrust line below the drag line adds a nose-up couple, so losing power lets the nose drop and protects the airspeed. Lowering flap moves the CP aft, a nose-down effect, but also increases the downwash at the tailplane, which increases its download, a nose-up effect; which one wins depends on the type.
Total reaction and the lift vector
The total reaction is the resultant of all the aerodynamic forces on the aerofoil. It is resolved into lift, perpendicular to the relative airflow, and drag, parallel to it. Lift is defined relative to the airflow, not to the chord, the aircraft's axes or the vertical, so the lift vector tilts with the flight path and with bank; in a turn its horizontal component supplies the turning force.
On a real wing the tip vortices induce downwash over the wing itself. This reduces the effective angle of attack below the geometric one by the induced angle of attack, and tilts the local lift vector rearwards. Its rearward component is induced drag, with CDi = CL² ÷ (π × aspect ratio). Within about a wingspan of the ground the vortices are restricted, downwash falls and the effective angle of attack rises, so the wing gives more lift for less induced drag and the aeroplane floats in the flare.
Frequently asked questions
How does a wing generate lift?
A wing at an angle of attack, or with camber, turns the air flowing past it downwards. To do so it sets up a pressure field in which the air over the upper surface speeds up and its pressure falls, while the pressure beneath rises slightly. The pressure difference over the wing area is the lift. Bernoulli's theorem describes the pressure side of this and Newton's laws the momentum side; they describe one flow, not two sources.
Is the equal transit time explanation of lift correct?
No. It claims that air over the longer upper surface must speed up to meet the lower-surface air at the trailing edge. Nothing requires the two to meet, and wind tunnel tests show the upper-surface air arriving well before the lower. The theory also fails to explain lift from symmetrical sections, flat plates and inverted flight. The FAA's handbook explains lift through Bernoulli and Newton together instead.
What is the lift equation?
Lift equals one half times air density times true airspeed squared times wing area times the lift coefficient: L = ½ρV²SCL. The term ½ρV² is the dynamic pressure, which the airspeed indicator measures, and the lift coefficient depends on the wing's shape and its angle of attack. In level flight lift equals weight, so each indicated airspeed at a given weight requires its own angle of attack.
What happens to lift if the airspeed doubles?
At a constant angle of attack, lift rises with the square of the speed, so doubling the speed gives four times the lift. In level flight the pilot therefore reduces the angle of attack as the aeroplane accelerates, keeping lift equal to weight. The same square law explains why stall speed rises only with the square root of weight or load factor.
What is the difference between the centre of pressure and the aerodynamic centre?
The centre of pressure is the point on the chord through which the resultant lift acts, and on a cambered aerofoil it moves forward as the angle of attack increases, then jumps aft at the stall. The aerodynamic centre is the fixed point, about 25 per cent of the chord at subsonic speeds, about which the pitching moment stays constant as the angle of attack changes, which makes it the reference for stability.
Test yourself on Lift
The v1prep banks cover this topic in Principles of Flight (081), with a worked explanation for every answer. EASA ATPL, PPL, IR and CPL, the FAA written tests and A320/B737 type ratings.
Start practising →Sources and further reading
Library articles are written for study and exam preparation. They do not replace your aircraft's approved documentation, your operator's procedures or the regulations themselves.