Power Curves and Speed Stability
Power curves plot the thrust or power an aeroplane needs for steady level flight, and the thrust or power its engines can supply, against airspeed. The gap between required and available sets climb and descent performance, and the slope of the required curve decides whether the aeroplane is speed stable.
Every steady flight condition is a balance between what the aeroplane needs and what its engines can give. Plotted against airspeed, the need appears as thrust required or power required, and the supply as thrust available or power available. These power curves are the working tools of aircraft performance: the gap between the two tells how steeply and how fast the aeroplane can climb, where they cross sets the maximum level speed, and the shape of the required curve decides how the aeroplane behaves when its speed is disturbed.
Thrust curves suit jets, whose thrust changes little with speed; power curves suit propeller aeroplanes, whose engines deliver roughly constant power. Both are drawn from the same total drag curve, and both lead to the same practical rule on the approach: below a certain speed the aeroplane becomes speed unstable, and height and speed must then be controlled differently.
Thrust required and thrust available
In steady level flight thrust equals drag, so the thrust required curve is simply the total drag curve. It is U-shaped: parasite drag rises with the square of the speed and induced drag falls with it, and the minimum, where the two are equal and the lift/drag ratio is greatest, is the minimum drag speed VMD.
Thrust available is what the engines can deliver at a given setting. For a jet it is roughly constant with speed at a given throttle setting. For a propeller aeroplane it is greatest at low speed and falls away as speed rises: the engine delivers roughly constant power, and thrust is power divided by speed. Level flight at full power is possible only where the thrust available at least equals the thrust required; the higher-speed crossing of the two curves is the maximum level speed.
The curves move with the flight condition:
- Weight. More weight means more induced drag, so the thrust required curve rises and VMD moves to a higher speed, in proportion to the square root of the weight.
- Altitude. Plotted against indicated airspeed the thrust required curve hardly changes with altitude, but thrust available falls as density falls, and falls further on a hot day.
- Configuration. Flaps, landing gear and speed brakes add parasite drag, raise the curve and move VMD to a lower speed.
Power required and power available
Power is force multiplied by speed. The power required for level flight is drag multiplied by true airspeed, and the power available is thrust available multiplied by true airspeed.
The power required curve is also U-shaped, but its minimum lies at a lower speed than VMD. Just below VMD drag is rising only slightly while the speed is falling, so their product is still falling; it reaches its minimum at the minimum power speed VMP and then rises again as induced drag climbs steeply.
Power available differs by engine type:
- Jet. Thrust is roughly constant, so power available rises almost in proportion to speed.
- Propeller. The engine delivers roughly constant shaft power, and the propeller converts it into thrust power with an efficiency that rises with speed through the climb range (see propeller aerodynamics). Power available therefore also rises with speed through that range.
Altitude affects both curves. At a given indicated airspeed the true airspeed is higher at altitude, so the power required rises. At the same time a normally aspirated piston engine loses power as density falls; FAA material puts the loss at roughly 3 per cent per 1,000 ft of density altitude, leaving about 75 per cent of sea-level power at 8,000 ft. The surplus shrinks from both sides, which is why climb performance falls steadily with height.
Minimum power speed
VMP, the minimum power speed, is the speed at which the least power is needed to hold level flight. For the idealised drag curve used in exam work it is VMD divided by the fourth root of 3, about 0.76 VMD, so it always lies on the back of the drag curve. Like VMD, it is a fixed indicated airspeed for a given weight and configuration, and it rises with the square root of the weight.
Because the fuel flow of a piston engine is roughly proportional to the power it produces, VMP gives the maximum endurance of a propeller aeroplane, the longest time in the air per unit of fuel. It is also the speed of the minimum rate of sink in a glide. A jet's fuel flow follows thrust rather than power, so its best endurance is at VMD.
| Speed | Where it sits | Propeller aeroplane | Jet |
|---|---|---|---|
| VMP, about 0.76 VMD | Minimum of the power required curve | Maximum endurance; minimum sink in a glide | Below its best endurance speed; speed unstable |
| VMD | Minimum of the drag curve, (L/D)max | Maximum range; best glide range | Maximum endurance; best glide range |
| About 1.32 VMD | Tangent from the origin to the drag curve | Faster than its best range speed | Maximum range |
The range and endurance speeds are developed in range, endurance and gliding.
Excess thrust and excess power
The gap between available and required is what climbs the aeroplane. In a steady climb at angle γ, the thrust must pay for the drag and lift the weight up the slope:
sin γ = (T − D) ÷ W
The climb angle therefore depends on excess thrust, thrust available minus thrust required, divided by the weight. The rate of climb is the true airspeed multiplied by sin γ, which gives:
rate of climb = (T − D) × TAS ÷ W = excess power ÷ W
The rate of climb depends on excess power, power available minus power required. Two different speeds follow:
- VX, best angle of climb, is the speed of the greatest excess thrust. For a jet, whose thrust hardly varies with speed, it lies close to VMD. For a propeller aeroplane, whose thrust falls with speed, it lies below VMD.
- VY, best rate of climb, is the speed of the greatest excess power. It is always higher than VX.
Anything that reduces the surplus reduces both angle and rate: more weight, higher altitude, higher temperature, bank, which adds induced drag in proportion to the square of the load factor, and above all an engine failure. Losing one engine of a light twin halves the power available but hardly changes the power required, so the excess, and with it the climb, typically falls by around 80 per cent (see asymmetric flight). As altitude increases the excess shrinks until, at the absolute ceiling, the curves just touch, VX and VY coincide and level flight is possible at only one speed. Climb speeds and ceilings are covered in climb performance.
Speed stability
Speed stability describes what happens to the airspeed after a disturbance when the pilot leaves the thrust or power setting unchanged. It is a property of the thrust and drag curves, not of pitch stability, and it explains much of how an aeroplane feels on the approach.
For a jet at a constant thrust setting:
- Above VMD, on the front of the drag curve, drag rises with speed. A gust that slows the aeroplane reduces its drag, so the thrust, now greater than the drag, accelerates it back; a gust that speeds it up increases drag and slows it again. The aeroplane is speed stable.
- Below VMD, on the back of the drag curve, drag rises as speed falls. A loss of speed increases drag, which slows the aeroplane further and increases drag again. The aeroplane diverges from its trimmed speed: this is speed instability, also called flying on the back of the drag curve. Only more thrust or a lower nose attitude stops it.
A propeller aeroplane at a constant power setting behaves the same way with respect to its power curve, so for it the dividing line is VMP, not VMD. FAA texts describe the same condition as flying on the back side of the power curve.
Configuration and weight move the boundary. Extending flaps, gear or speed brakes adds parasite drag and lowers VMD, so a given approach speed lies further above it; the extra drag also makes the curve steeper above VMD, and EASA training material treats it as improving speed stability on the approach. A heavier aeroplane has a higher VMD, which moves a given speed closer to the back of the curve.

The region of reversed command
FAA material divides the power curve into two regions. In the region of normal command, above the minimum power speed, flying slower needs less power and flying faster needs more. In the region of reversed command, below it, induced drag rises so quickly that flying slower needs more power. European texts cover the same idea as the back of the drag curve and speed instability, drawn on the drag curve with VMD as the boundary.
Several things change for the pilot in the region of reversed command:
- Lowering the nose alone does not make the aeroplane accelerate without losing height.
- A power reduction produces a large increase in the rate of descent.
- Raising the nose to stop a sink slows the aeroplane, increases its drag and makes the sink worse.
The technique follows. On a slow approach, such as a short-field approach flown near 1.3 VS0 in a light aeroplane, the FAA teaches that power controls the rate of descent and pitch controls the airspeed. An aeroplane that is sinking below the desired path while on the back of the curve is recovered by adding power, not by raising the nose.
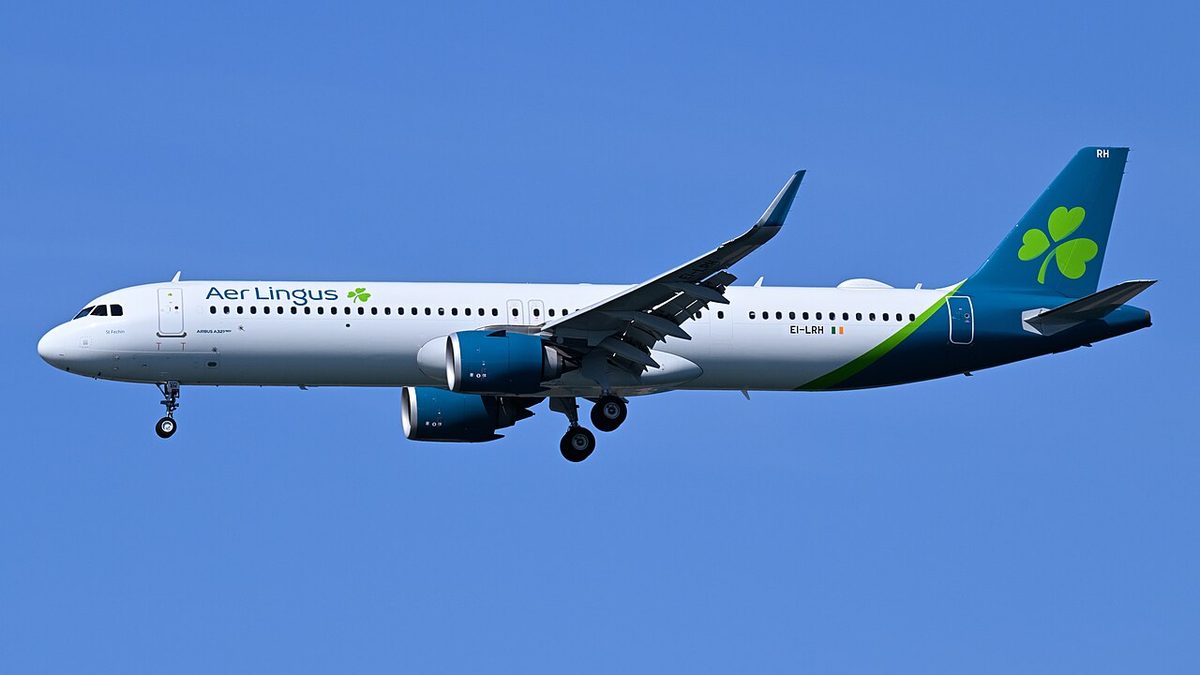
Jet transports meet the same physics on the approach. A swept-wing jet on final can be on the back side of the power curve, and a high-bypass turbofan takes 5 to 8 seconds to spool up from idle to go-around thrust. Speed control therefore demands anticipation, and approaches are flown with a small thrust margin, which is one reason for stabilised approach criteria. An autothrust system holding a selected speed compensates for the instability automatically, which is why it is felt most when thrust is flown manually.
Exam tip: below VMD a jet is speed unstable at constant thrust; below VMP a propeller aeroplane is speed unstable at constant power. The FAA calls the region below VMP the region of reversed command, and the cure for a sink there is power, not back pressure.
Gliding and power-on descents
In a glide there is no thrust, and only lift, weight and drag act. Lift balances the component of weight perpendicular to the path, W cos γ, and drag is balanced by the component along the path, W sin γ. Dividing one by the other shows that the glide ratio, distance flown per unit of height lost, equals the lift/drag ratio. The flattest glide is therefore at VMD, where L/D is greatest: with an (L/D)max of 12, a glide from 5,000 ft covers about 10 NM in still air.
Seen through the power curves, the glide has no power available, so the rate of descent equals the power required divided by the weight. It is least at VMP, which gives the longest time in the air but a steeper path than VMD. Weight does not change the best glide angle, because it does not change (L/D)max; a heavier aeroplane glides as far, but at a higher speed and a higher rate of descent. Into a headwind the ground distance is improved by flying slightly faster than VMD. A windmilling propeller adds a large drag, and on a single-engine aeroplane without feathering, setting the propeller control to fully coarse reduces it.
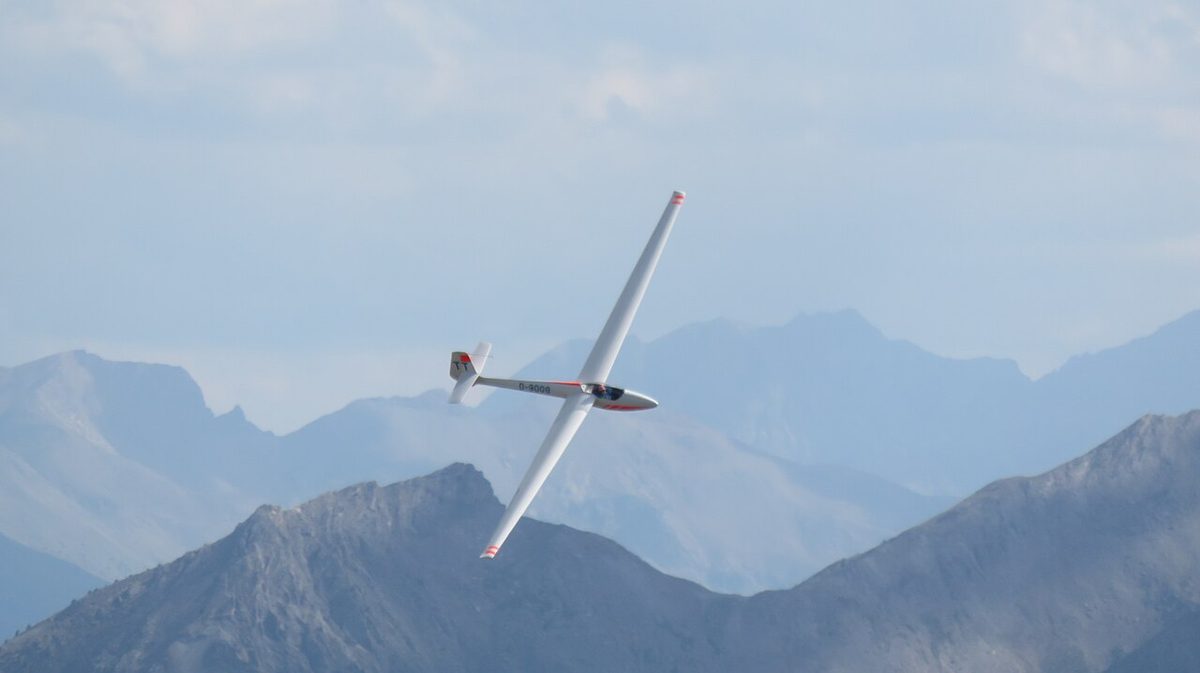
In a power-on descent thrust is present but less than drag, and the component of weight along the path makes up the difference:
T + W sin γ = D, so the descent gradient is (D − T) ÷ W
As in any descent, lift is less than weight, since it balances only W cos γ. The rate of descent is the true airspeed multiplied by sin γ, which equals the power deficit, power required minus power available, divided by the weight: the mirror image of the rate of climb. A standard 3° approach path is a gradient of about 5.2 per cent, or about 318 ft per nautical mile, so on it the weight supplies roughly a twentieth of itself along the path and the thrust set must provide the rest of the drag. More thrust flattens the descent at the same speed; idle thrust with speed brakes, gear or flap steepens it.
Note: "power" in these curves means the rate of doing work, drag times true airspeed, not the power setting shown on the engine instruments. For a jet the thrust curves tell the same story more directly, which is why jet performance texts work in thrust and propeller texts in power.
Frequently asked questions
What is the difference between the drag curve and the power required curve?
The drag curve plots the thrust needed for level flight, which equals drag, against airspeed; its lowest point is the minimum drag speed VMD. The power required curve plots drag multiplied by true airspeed, the rate at which work must be done; its lowest point is the minimum power speed VMP, about 0.76 VMD. Jet performance is best read from the thrust curves, propeller performance from the power curves.
What is the region of reversed command?
The region of reversed command is the FAA name for flight below the minimum power speed, where flying slower needs more power, not less, because induced drag rises steeply. Above that speed, in the region of normal command, slower flight needs less power. In the region of reversed command the aeroplane will not accelerate by lowering the nose without losing height, and power, not pitch, must control the rate of descent.
What does speed stable mean?
An aeroplane is speed stable when, with the thrust or power left unchanged, it tends to return to its trimmed speed after a disturbance. Above VMD a loss of speed reduces drag, so the aeroplane accelerates back. Below VMD a loss of speed increases drag, so it slows further: it is speed unstable. For a propeller aeroplane at constant power the dividing line is the minimum power speed rather than VMD.
Why does excess power determine rate of climb and excess thrust the climb angle?
In a steady climb the thrust left over after drag has been paid for lifts the weight up the slope, so the sine of the climb angle equals excess thrust divided by weight. Rate of climb is that gradient multiplied by the true airspeed, which equals excess power divided by weight. The best angle of climb, VX, is where excess thrust peaks; the best rate, VY, is where excess power peaks, at a higher speed.
Which speed gives the minimum rate of descent in a glide?
In a glide there is no power available, so the rate of descent equals the power required divided by the weight. It is therefore least at the minimum power speed VMP, about 0.76 VMD, which gives the longest time in the air. The flattest glide, and so the greatest still-air distance, comes at VMD, the speed of the best lift/drag ratio, at the cost of a slightly higher rate of descent.
Test yourself on Power Curves and Speed Stability
The v1prep banks cover this topic in Principles of Flight (081), with a worked explanation for every answer. EASA ATPL, PPL, IR and CPL, the FAA written tests and A320/B737 type ratings.
Start practising →Sources and further reading
- FAA Pilot's Handbook of Aeronautical Knowledge (FAA-H-8083-25), Chapter 5, Aerodynamics of Flight, and Chapter 11, Aircraft Performance
- FAA Airplane Flying Handbook (FAA-H-8083-3C), Approaches and Landings
- EASA, Explanatory Note to ED Decision 2018/001/R, Part-FCL theoretical knowledge learning objectives
- NASA Glenn Research Center, Lift to Drag Ratio
Library articles are written for study and exam preparation. They do not replace your aircraft's approved documentation, your operator's procedures or the regulations themselves.