Aeronautical Charts
Aeronautical charts are maps and diagrams made for air navigation, drawn to ICAO Annex 4 standards or national equivalents. They range from topographical VFR charts and IFR en-route charts to instrument approach charts and aerodrome diagrams, kept current on published revision cycles.
An aeronautical chart is a map or diagram made for air navigation. Beside the ground features any map shows, it carries what a pilot needs and a road map lacks: airspace, aerodromes, radio aids, obstacles, minimum altitudes and procedures. Each type of chart is built for one phase of flight, from the topographical chart a VFR pilot map-reads on to the instrument approach chart flown down to minima.
Charts are only as good as their currency. Airspace, frequencies and obstacles change constantly, so every chart belongs to a revision cycle and is amended between editions by NOTAM. EASA subjects 033 Flight Planning and 061 General Navigation, and the FAA knowledge tests, all expect a pilot to read the symbols, measure on the chart and know which publication holds what. How the curved Earth is drawn on the flat sheet is covered in chart projections.
ICAO Annex 4 chart standards
ICAO Annex 4, Aeronautical Charts, sets the Standards and Recommended Practices for chart types, content, symbols and accuracy, so that a pilot trained in one State can read the charts of another. Charts are one of the aeronautical information products a State provides under Annex 15, alongside the AIP, NOTAM and circulars. France, for example, states that its charts serving international requirements are established within the provisions of Annex 4, others to national criteria, and lists what it publishes:
| Chart (ICAO name) | Scale in France | Use |
|---|---|---|
| En-route chart, lower and upper airspace | 1:2 000 000 | IFR route structure |
| Area chart | Various | IFR in busy terminal areas |
| SID and STAR charts | Various | Instrument departures and arrivals |
| Instrument approach chart | Various | Approach to minima |
| Visual approach chart | Various | VFR arrival and departure |
| Aerodrome chart | 1:10 000 | Runways, taxiways, aprons |
| Aerodrome ground movement and parking/docking charts | Various | Taxi and parking |
| Aerodrome obstacle chart, Type A | 1:15 000 horizontal, 1:1 500 vertical | Obstacles in the take-off flight path area |
| Precision approach terrain chart | 1:2 500 horizontal, 1:500 vertical | Terrain before the threshold, for radio altimeter use |
| Aeronautical chart ICAO 1:500 000 | 1:500 000 | VFR navigation |
Annex 4 also defines the World Aeronautical Chart (WAC) ICAO 1:1 000 000, a smaller-scale series for longer legs. Not every State produces it: France lists no WAC sheets and publishes its own 1:1 000 000 VFR chart instead. Commercial charts, such as Jeppesen's, redraw State data in a uniform style; the AIP remains the authoritative source.
VFR topographical charts
The ICAO 1:500 000 aeronautical chart is the standard VFR chart in Europe. It is drawn on a Lambert conformal conic projection, so a ruled line is very nearly a great circle and the scale is practically constant; 1 cm represents 5 km. In France it is published in four sheets, supplemented by a 1:1 000 000 VFR chart in two sheets and 1:250 000 VFR charts of several regions, such as the Paris region.
In the United States the equivalent is the sectional aeronautical chart, also 1:500,000, about 6.86 NM to the inch. Around Class B airspace the terminal area chart (TAC) shows the same information at 1:250,000. Some TACs carry a VFR flyway planning chart on the reverse, showing general flight paths that keep VFR traffic clear of Class B airspace without an ATC clearance. Sectionals and TACs are revised every 56 days; each edition is valid only to the date printed on its panel.
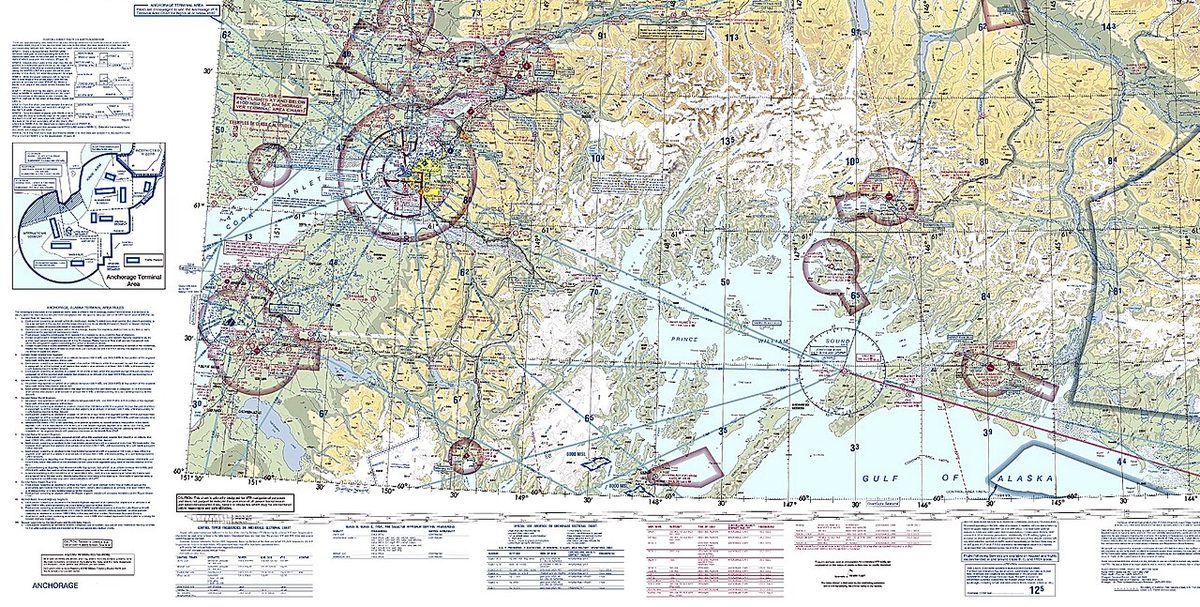
The content is similar on both sides of the Atlantic:
- Aerodromes, with elevation, runway and radio data. On sectionals a towered aerodrome is blue and a non-towered one magenta, and the data block gives elevation, lighting, the longest runway in hundreds of feet and the CTAF.
- Airspace boundaries, classes, vertical limits and restricted, danger and prohibited areas.
- Radio aids with frequency and identifier; a VOR's compass rose is oriented to magnetic north.
- Isogonals, dashed lines joining places of equal magnetic variation.
- Obstacles. The sectional gives the elevation of the top in feet MSL with the height above ground in brackets below it; the French legend gives the elevation of the top above mean sea level and, where relevant, the height above aerodrome level.
- VFR reporting points, drawn in the ICAO style as a filled triangle when compulsory and an open one when on request.
- The graticule. On a sectional, parallels and meridians are printed every 30′ with a tick every minute, so the ticks along a meridian form a nautical-mile scale.
Red cockpit lighting badly distorts chart colours, and red or magenta detail can almost vanish under it, so the FAA advises that white lighting be available for reading charts at night.
Relief, contours and maximum elevation figures
Terrain is shown in three ways. Contour lines join points of equal elevation, hypsometric tints (layer tints) colour the bands between them, and spot heights mark summits and other points. In the French chart legend the highest spot elevation is shown boxed. All of them are elevations in feet above mean sea level, so they can be compared directly with an altimeter set to QNH.
The maximum elevation figure (MEF) on FAA sectionals is printed in each 30′ by 30′ quadrangle in thousands and hundreds of feet. For natural terrain it is the highest elevation plus 100 ft for vertical error and 200 ft for possible uncharted obstacles, rounded up to the next 100 ft; where a man-made obstacle more than 200 ft above the highest terrain sets the figure, only the 100 ft is added.
| Highest feature in quadrangle | Calculation | MEF printed |
|---|---|---|
| Terrain 4,120 ft | 4,120 + 100 + 200 = 4,420 ft, rounded up | 4,500 ft (large 4, small 5) |
| Mount Rainier summit 14,410 ft | 14,410 + 100 + 200 = 14,710 ft, rounded up | 14,800 ft (148) |
An MEF covers its whole quadrangle, so high ground far off track can set a high figure over open water. It is not a safe altitude: the pilot adds a clearance margin. A common VFR planning method takes the highest obstacle within 5 NM either side of track, adds 1,000 ft and rounds up to the next 100 ft.
Warning: chart elevations are above mean sea level, but an altimeter over-reads in air colder than standard and when the QNH is out of date in falling pressure. The aeroplane is then lower than indicated, so extra margin is needed over high ground.
IFR charts carry equivalent figures with a built-in clearance. The FAA off-route obstruction clearance altitude (OROCA) clears the highest obstruction in its quadrangle by 1,000 ft, or 2,000 ft in designated mountainous areas, without assuring navigation or communication signals. Jeppesen's grid and route MORA give 1,000 ft of clearance where the terrain is 5,000 ft or lower and 2,000 ft above that, the route MORA covering 10 NM either side of the centreline. See minimum safe altitudes.
IFR en-route charts
The en-route chart shows the ATS route network: airways with their designators, tracks, distances, minimum altitudes and reporting points, the radio aids and fixes that define them, airspace boundaries and frequencies. France publishes separate lower and upper airspace charts at 1:2 000 000; busy terminal areas are enlarged on area charts.
The FAA divides the task by altitude. The IFR en route low altitude chart covers the airspace below 18,000 ft MSL. It shows the Victor airways, which extend 4 NM either side of the centreline from 1,200 ft AGL up to, but not including, 18,000 ft MSL, their minimum en-route altitudes and the OROCA for each quadrangle. Airports with a published instrument approach are shown in blue or green and those without in brown, unlike the sectional, where the colour reflects the presence of a tower. The high altitude charts cover 18,000 ft MSL and above, where jet routes in Class A airspace apply.
Commercial en-route charts add their own symbols. On Jeppesen en-route charts a shaded square marks a speed limiting point (SLP), from which a maximum indicated airspeed applies. The example usually quoted is the London terminal area, where a maximum of 250 kt IAS applies from the SLP or from three minutes before the holding facility. An E beside an airway altitude means even levels are flown in the direction of the arrow. The route structure itself is covered in airways and ATS routes.
Instrument approach charts and airport diagrams
An instrument approach chart presents one procedure: a plan view of the tracks, fixes and minimum sector altitudes, a profile view of the descent with its altitudes and distances, the missed approach, and a table of minima. Altitude constraints follow a code: in the French legend a figure underlined is "at or above", one with a bar above it is "at or below", one with bars above and below is mandatory, and a figure with no bar is a recommended procedure altitude. See instrument approach procedures.
FAA approach charts add symbols of their own. A black triangle with a white T sends the pilot to the front of the procedures book for non-standard take-off minima or a departure procedure, and one with an A for non-standard alternate minima, with NA meaning the airport cannot be used as an alternate. Terrain relief is charted when terrain in the plan view rises more than 4,000 ft above the airport, or more than 2,000 ft within 6 NM of it.
The airport diagram, the ICAO aerodrome chart, shows runways, taxiways, aprons and buildings. Hot spots, complex or confusing intersections with a history or risk of surface incidents such as runway incursions, are circled and labelled HS with a number, and on FAA approach charts a boxed D in the airport sketch shows that runway declared distance information is available.
Chart supplements and procedure publications
Much of what a pilot needs cannot be drawn on a chart. In ICAO States it is in the AIP, which holds aerodrome data and charts in its AD part and the route structure in ENR. Changes follow the AIRAC cycle of 28 days and are distributed at least 42 days before they take effect. France keeps its AIP charts current first by hand corrections from NOTAM, then by bulletins of hand amendments and finally by reissue, and lists known errors on its VFR charts, which are not part of the AIP, in GEN 3.2.8, which is worth reading before the season's first flight.
In the United States the Chart Supplement, formerly the Airport/Facility Directory, gives runway data, lighting, frequencies, services, tower hours, part-time airspace status and remarks for each public airport, in regional volumes published every 56 days. The Terminal Procedures Publication (TPP) contains the instrument approach charts, airport diagrams, departure procedures and arrivals, together with the take-off, departure and alternate minima listings and the hot spot pages. It also follows a 56-day cycle, with a change notice at 28 days, and FDC NOTAMs amend procedures in between.
Some procedures need more than the chart. Simultaneous close parallel PRM approaches are published with an Attention All Users Page (AAUP), which sets out the procedures for conducting them; pilots must have completed the required PRM training before accepting such a clearance. Electronic charts on an electronic flight bag are subject to the same currency requirements as paper ones.
Plotting charts and navigation plotters
A plotting chart is a chart reduced to little more than the graticule, on a conformal projection, used to plot routes, dead-reckoning positions and fixes where topographical detail is unnecessary, typically over the ocean. Chart plotting follows a routine: rule the track, measure its direction at the mid-meridian, measure distances with dividers against the latitude scale near the line, then plot each fix as it is obtained. A single bearing or radial gives a position line; two or three give a fix, and three normally form a small triangle, the cocked hat, with the position taken at its centre. On a Mercator plotting chart a radio bearing must be corrected by the conversion angle; on a Lambert chart it can be drawn directly.
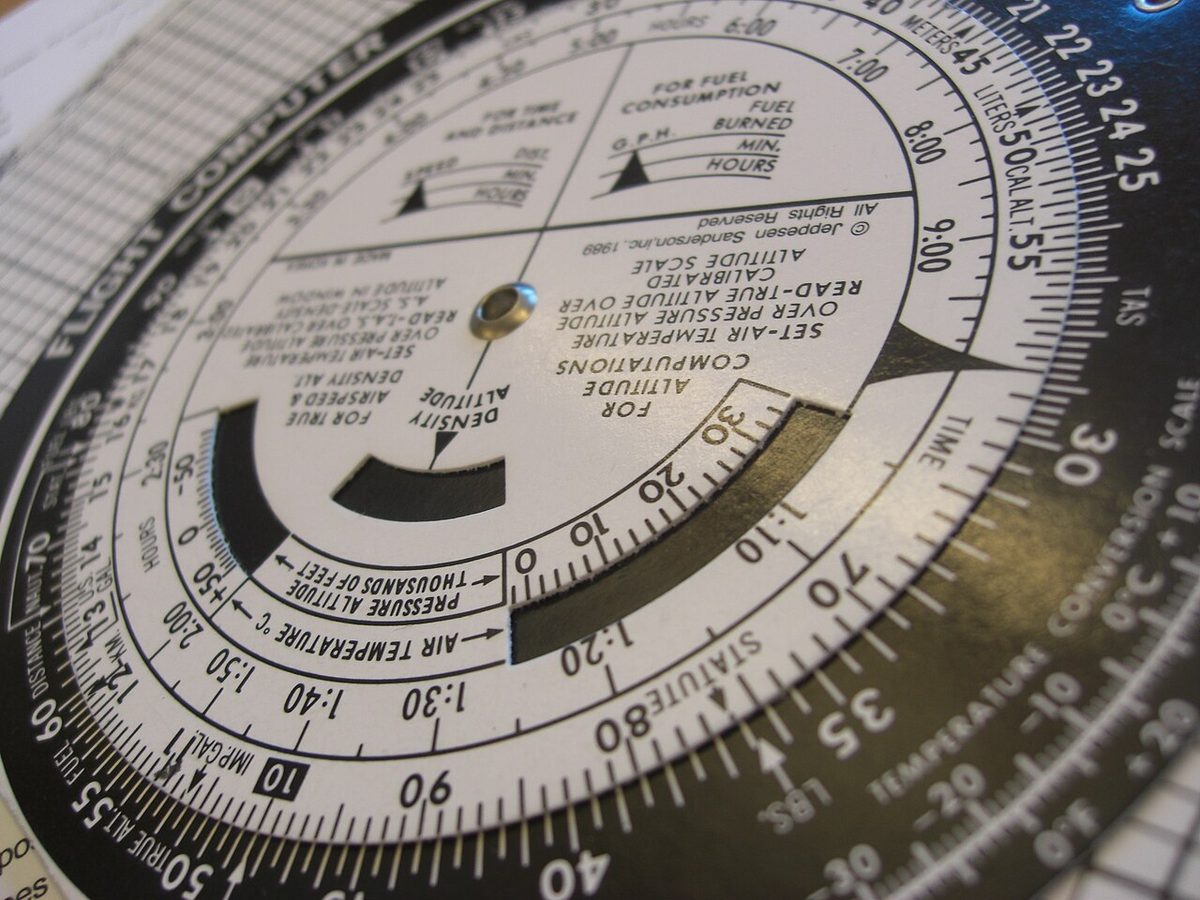
The pilot's tools are a navigation plotter or protractor for tracks and bearings, dividers for distances, a soft pencil, and a navigation computer such as the CRP-5 or E6B for speed, time, fuel and wind triangles. The FAA-style plotter combines a protractor with straight-edge scales for the common chart scales. For a quick diversion, laying the plotter from the aircraft's position to the new destination and reading the course against a nearby VOR compass rose gives a magnetic course directly; the methods are covered in dead reckoning and visual navigation.
Frequently asked questions
What scale is a VFR aeronautical chart?
The standard VFR chart in Europe is the ICAO aeronautical chart at 1:500 000, on which 1 cm represents 5 km. The FAA sectional chart uses the same scale, about 6.86 NM to the inch, and the FAA terminal area chart doubles it to 1:250,000 around Class B airspace. Some States add 1:250 000 charts of busy regions and 1:1 000 000 charts for longer legs.
What is a maximum elevation figure (MEF)?
The MEF is printed in each quadrangle of an FAA sectional chart, in thousands and hundreds of feet above mean sea level. For natural terrain it is the highest elevation plus 100 ft for vertical error and 200 ft for possible uncharted obstacles, rounded up to the next 100 ft. It is a reference figure, not a safe altitude, so the pilot must add a terrain clearance margin before choosing a cruising altitude.
How often are aeronautical charts updated?
Aeronautical information changes on the ICAO AIRAC cycle of 28 days, and charts are reissued or amended to match. FAA sectional and terminal area charts, the Terminal Procedures Publication and the Chart Supplement are published every 56 days, the procedures with a change notice at 28 days. Between editions, changes are promulgated by NOTAM, and an expired chart should not be used.
What is the FAA Chart Supplement?
The Chart Supplement, formerly the Airport/Facility Directory, is the FAA publication that lists what the charts cannot show. It gives runway dimensions and surfaces, lighting and pilot-controlled lighting frequencies, communication frequencies, services and fuel, tower hours, part-time airspace status and remarks for each airport, plus navaid data and other tables. It is issued every 56 days in regional volumes.
What is the difference between the IFR en route low and high altitude charts?
The FAA IFR en route low altitude charts cover the airspace below 18,000 ft MSL and show the Victor airways, which extend 4 NM either side of their centreline, with minimum altitudes and off-route obstruction clearance altitudes. The high altitude charts cover 18,000 ft MSL and above, where the jet route structure applies in Class A airspace.
Test yourself on Aeronautical Charts
The v1prep banks cover this topic in General and Radio Navigation (061/062), with a worked explanation for every answer. EASA ATPL, PPL, IR and CPL, the FAA written tests and A320/B737 type ratings.
Start practising →Sources and further reading
- ICAO Annex 4, Aeronautical Charts
- AIP France, GEN 3.2, Aeronautical Charts
- AIP France, GEN 2.3, Chart Symbols
- FAA Aeronautical Chart Users' Guide
- FAA Aeronautical Information Manual, Chapter 3 Section 5 (3-5-5, Published VFR Routes)
- FAA Aeronautical Information Manual, Chapter 5 Section 4 (5-4-16, PRM approaches and the AAUP)
- FAA Pilot's Handbook of Aeronautical Knowledge (FAA-H-8083-25), Chapter 16, Navigation
- FAA Aeronautical Information Manual, Chapter 8 Section 1 (8-1-6, vision in flight and cockpit lighting)
Library articles are written for study and exam preparation. They do not replace your aircraft's approved documentation, your operator's procedures or the regulations themselves.