Chart Projections
A chart projection is a systematic method of drawing the Earth's graticule of meridians and parallels on a flat sheet. No projection can keep every property of the globe, so navigation charts use conformal projections, which keep angles and local shapes true at the expense of constant scale.
A chart projection is the method used to transfer the graticule, the network of meridians and parallels, from the curved surface of the Earth to a flat sheet. A sphere cannot be flattened without stretching or tearing, so every projection distorts something: shape, area, distance, direction or the way routes appear. The choice of projection decides which of these the chart keeps and which the navigator must allow for.
Navigation charts are almost all conformal, because a pilot needs to measure tracks and bearings with a protractor and trust the answer. Three projections cover most of aviation: the Mercator for low latitudes and plotting, the Lambert conformal conic for the middle latitudes, where most VFR and en-route charts are drawn, and the polar stereographic near the poles. EASA 061 General Navigation examines their properties and the arithmetic of scale and convergency; the FAA tests expect a pilot to know that a sectional chart is a Lambert projection and to measure courses accordingly. The geometry of great circles, rhumb lines and Earth convergency on which this article builds is covered in the Earth: shape, coordinates and great circles.
Properties of an ideal chart
An ideal navigation chart would have all of the following:
- Conformality (orthomorphism): angles on the chart equal angles on the Earth, so shapes of small areas are correct. Two conditions define it: meridians and parallels cross at right angles, and at any point the scale is the same in every direction. It does not require the scale to be the same everywhere on the sheet.
- Constant scale over the whole sheet.
- Great circles as straight lines, so the shortest route can be ruled.
- Rhumb lines as straight lines, so a constant track can be ruled.
- Correct area, the property of an equal-area projection.
- Correct convergency, meridians meeting on the chart at the angle they meet on the Earth.
- Easy plotting of positions, and adjacent sheets that fit together.
No flat chart achieves all of these. Conformality and equal area are mutually exclusive, and apart from the equator and the meridians no line can be both a great circle and a rhumb line, so no chart can show both as straight. Aviation gives up equal area and constant scale in order to keep directions true.
Classes of projection
Projections are classified by the surface on which the graticule is conceived to be drawn and then unrolled:
| Class | Surface | Aviation example |
|---|---|---|
| Cylindrical projection | A cylinder around the globe | Mercator, transverse and oblique Mercator |
| Conic projection | A cone placed over the globe | Lambert conformal conic |
| Azimuthal (planar) projection | A flat plane touching the globe at one point | Polar stereographic |
The surface may be tangent, touching the Earth along one line or at one point, or secant, cutting it along two lines. Scale is correct only where the surface meets the globe. The aspect describes how the surface is oriented: normal (the cylinder or cone aligned with the Earth's axis), transverse (turned through 90°) or oblique. Most navigation projections are defined mathematically to achieve a property such as conformality, not by shining an imaginary light through the globe; the cylinder, cone and plane describe the shape of the result.
Chart scale and representative fraction
Chart scale is the ratio of a distance on the chart to the corresponding distance on the Earth. It is given as a representative fraction, such as 1:500 000, meaning one unit on the chart represents 500 000 of the same units on the ground; as a statement, such as 1 cm to 5 km; or as a graduated scale line. A larger denominator means a smaller scale and less detail, so a 1:250 000 chart is larger-scale than a 1:500 000 one.
| Scale | Measured | Ground distance |
|---|---|---|
| 1:500 000 | 6 cm | 30 km, about 16 NM |
| 1:250 000 | 11.1 cm | 27.75 km, about 15 NM |
| 1:1 000 000 | 5.5 cm | 55 km, about 30 NM |
| 1:500 000 (FAA sectional) | 1 inch | about 6.86 NM |
Exam tip: convert chart centimetres to kilometres first, then divide by 1.852 to get nautical miles. Stopping at kilometres and calling them nautical miles is the classic slip.
Since the scale of any flat chart varies across the sheet, the printed scale is exact only in certain places. The most reliable way to measure distance is against the latitude scale close to the line being measured, because one minute of latitude is one nautical mile.
Direct Mercator projection
The Mercator projection is cylindrical, with the cylinder tangent to the Earth at the equator. Meridians are straight, parallel and evenly spaced. Because real meridians converge, holding them parallel stretches the east–west scale by the secant of the latitude; to stay conformal the north–south scale is stretched by the same factor, so the parallels are drawn further apart towards the poles.
- Scale expands with sec latitude: correct at the equator, double at 60°, almost six times at 80°. The poles are at infinity and cannot be shown.
- A chart of 1:1 000 000 at the equator is about 1:866 000 at 30°; one of 1:2 000 000 at the equator is 1:1 000 000 at 60°.
- A rhumb line is a straight line, which is Mercator's defining advantage for constant-track plotting.
- A great circle is a curve, concave to the equator and bulging towards the nearer pole, so it always lies on the polar side of the rhumb line.
- Chart convergency is zero at all latitudes: the chart does not represent the real convergence of the meridians.
- Distance is measured on the latitude scale at the mean latitude of the line.
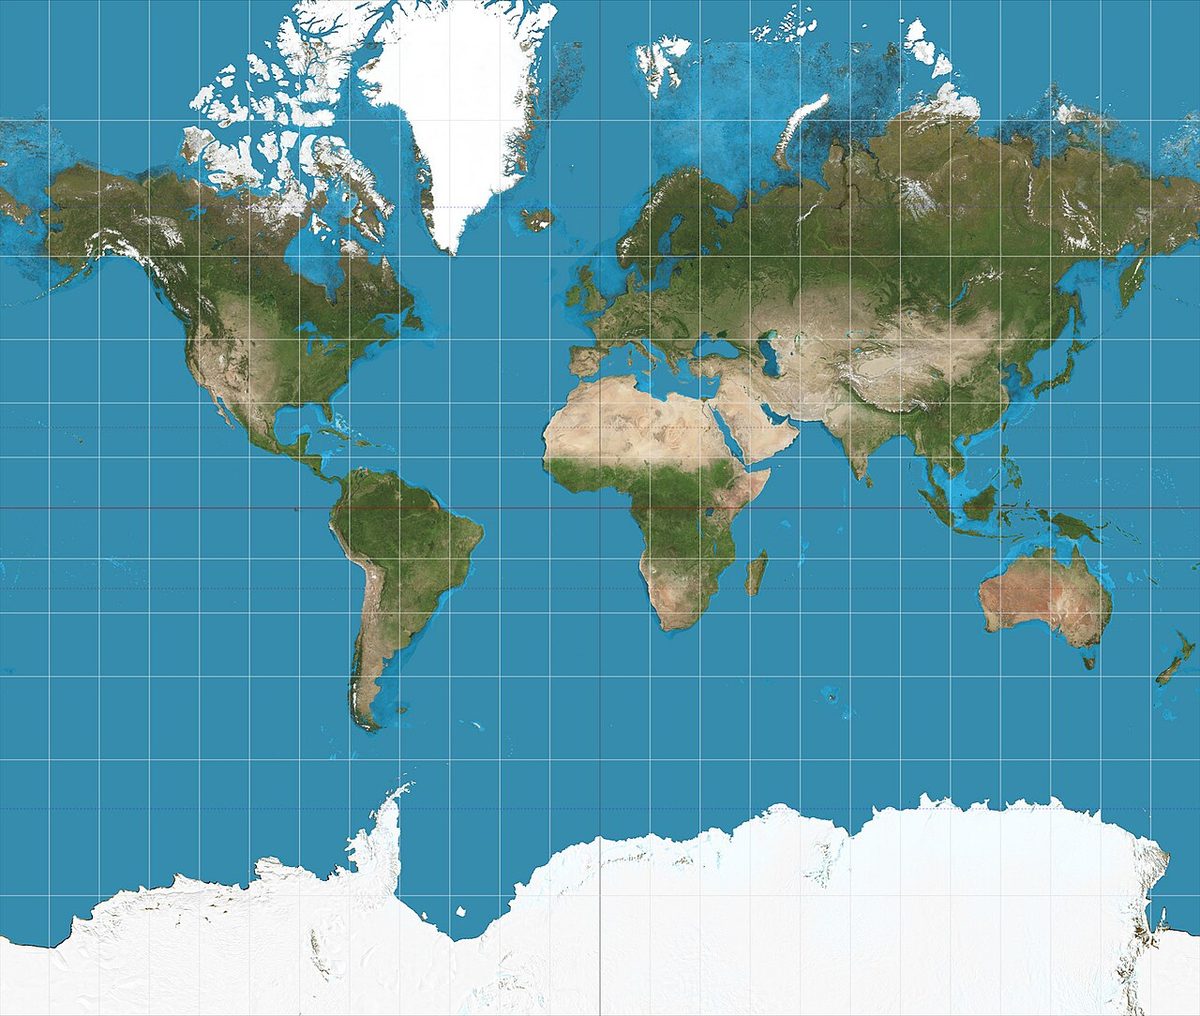
Radio bearings travel along great circles, but a straight line on a Mercator is a rhumb line, so a bearing must be corrected by the conversion angle, half the Earth convergency between the station and the aircraft, before it is plotted. A VDF station at 30°N 010°W measuring an aircraft at 30°N 030°W on a great-circle bearing of 275° has an Earth convergency of 20° × sin 30° = 10°, so the conversion angle is 5° and the line is drawn from the station on 270°.
A secant (modified) Mercator projection uses a cylinder that cuts the Earth along two parallels. Scale is correct on those parallels, slightly contracted between them and expanded outside, which reduces the scale error over a band of middle latitudes. Mercator is at its best in low latitudes and becomes unusable towards the poles.
Transverse and oblique Mercator
Turning the cylinder through 90° gives the transverse Mercator projection, tangent along a chosen central meridian and its anti-meridian. The properties of the normal Mercator carry over to the new orientation: the chart is conformal, the scale is correct along the central meridian and grows with distance from it, and the chart is accurate in a narrow band running north–south. Near the central meridian, great circles are close to straight lines.
The oblique Mercator projection sets the cylinder tangent along any chosen great circle, typically a long route. The scale is then correct along the route and the chart gives an accurate strip either side of it. Both forms can be used for plotting charts in polar regions, alongside the polar stereographic.
Lambert conformal conic projection
The Lambert conformal conic projection uses a cone that cuts the Earth along two standard parallels. Scale is correct on the standard parallels, slightly contracted between them and slightly expanded outside. With the standard parallels well placed, conventionally about one sixth of the chart's latitude band in from each edge, the scale error stays within about 1%, so a single scale line can be used anywhere on the sheet.
- Meridians are straight lines converging towards the apex of the cone; parallels are arcs of concentric circles.
- The parallel of origin lies approximately midway between the standard parallels; with standard parallels at 35°N and 65°N it is about 50°N.
- A great circle is very nearly a straight line; strictly it is a slight curve concave to the parallel of origin.
- A rhumb line is a curve concave to the nearer pole, lying on the equatorial side of the great circle.
- Radio bearings can be plotted as straight lines with negligible correction.

These properties explain why the ICAO 1:500 000 aeronautical chart and FAA sectional charts use the Lambert projection. A ruled line is the great-circle route, and because the meridians converge, the line crosses each one at a slightly different angle. Measuring its direction at the meridian nearest the middle of the leg gives the mean true track; measuring at the departure meridian gives the initial great-circle track.
Note: on a conic chart an orientation error that is zero at the centre and grows east and west of it follows the same pattern as chart convergency. AIP France records that the VOR compass roses on the 2026 edition of its 1:500 000 ICAO chart were misoriented by an error negligible at the centre of the projection, reaching 5.4° at Brest in the west and 3.4° at Strasbourg in the east, to be corrected in the 2027 edition.
Polar stereographic projection
The polar stereographic projection is azimuthal: a plane tangent at the pole onto which the graticule is projected from the opposite pole. It is conformal.
- Meridians are straight lines radiating from the pole, separated on the chart by their true change of longitude.
- Parallels are concentric circles centred on the pole, spaced further apart away from it.
- Scale is correct at the pole and expands away from it by sec² of half the co-latitude, about 1.17 at 45° of latitude.
- A great circle is almost a straight line near the pole (strictly a gentle curve concave to the pole).
- A rhumb line spirals around the pole, approaching it without reaching it.
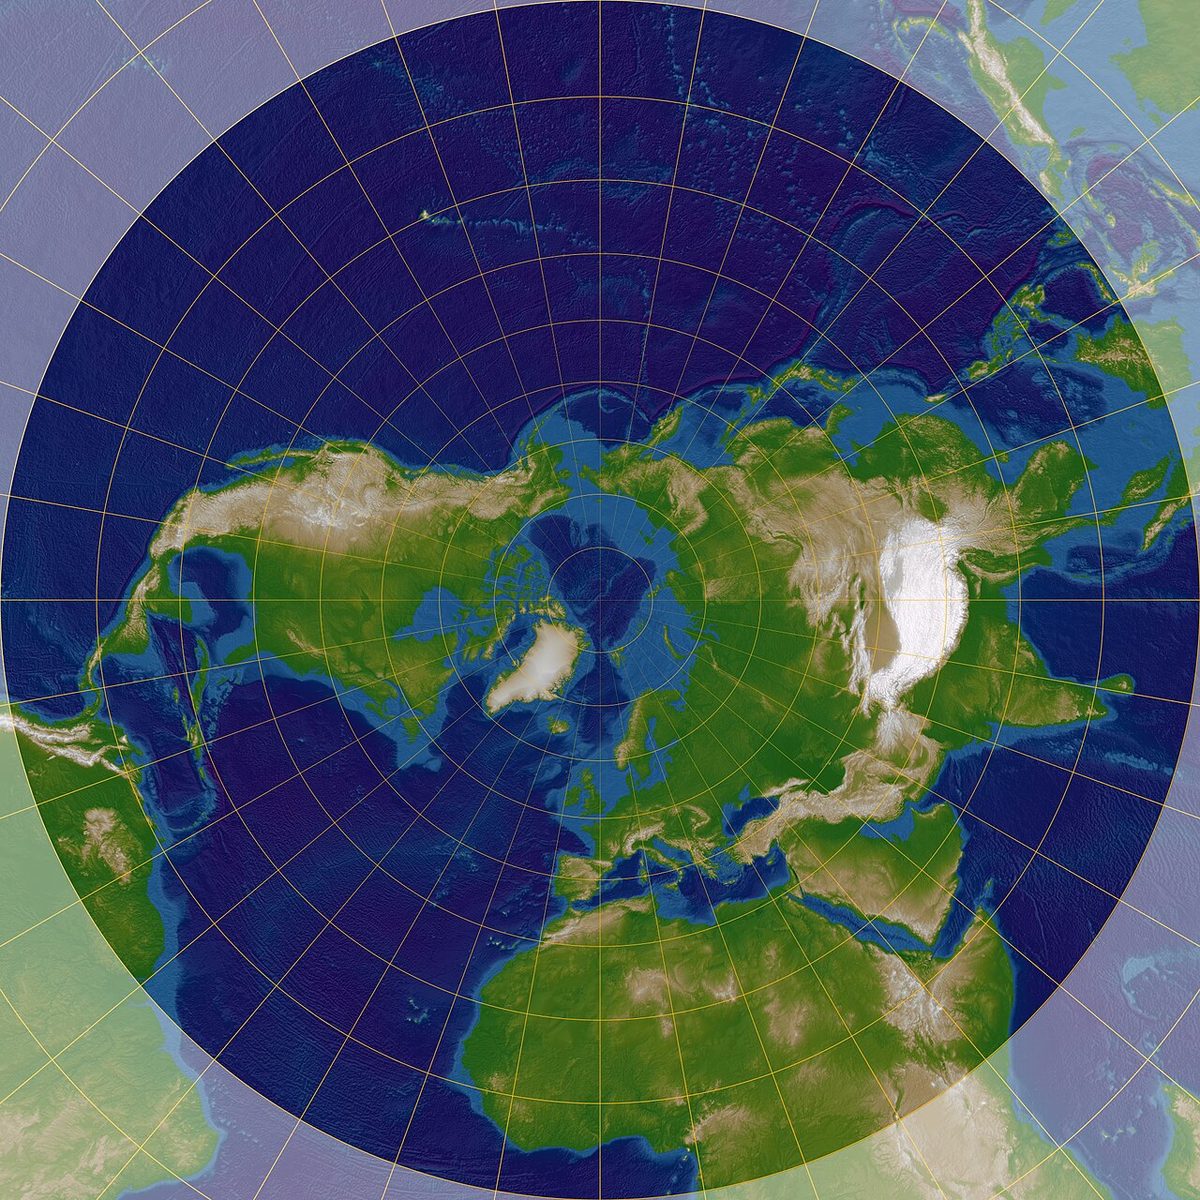
Because a straight line is almost a great circle and the meridians meet at their true angle, polar stereographic charts carry the grids used for polar and grid navigation. On a northern polar chart whose grid is aligned with the Greenwich meridian, the convergency at any meridian equals the longitude with its sign reversed; at 78°N 040°W a true track of 350° is a grid track of 030°.
Chart convergency and the constant of the cone
Earth convergency, the angle between two meridians, is the change of longitude multiplied by the sine of the mean latitude. Chart convergence, or chart convergency, is the angle at which the same two meridians meet on the chart. For a conic chart it equals the change of longitude multiplied by the constant of the cone, also called the chart constant, convergence factor or n-factor:
chart convergency = change of longitude × n
For a Lambert chart n is the sine of the parallel of origin. The chart convergency is therefore the same wherever it is measured on the sheet, and it equals Earth convergency only at the parallel of origin; poleward of it the Earth convergency is greater, equatorward it is less. A cylinder can be treated as a cone with its apex at infinity, and a plane as a cone flattened completely, which gives the two limiting values:
| Projection | n | Chart convergency | Equals Earth convergency |
|---|---|---|---|
| Direct Mercator | 0 | Zero | At the equator only |
| Lambert conformal conic | sin (parallel of origin) | ch. long × n, constant | At the parallel of origin |
| Polar stereographic | 1 | Equal to ch. long | At the pole |
On a Lambert chart with its parallel of origin at 45°N, two meridians 30° apart converge by 30 × 0.707, about 21°, and the meridians 010°E and 030°E by about 14.1°. A straight line crossing from one to the other changes its measured track by exactly the chart convergency, which is why the initial and final tracks of a ruled great circle differ, and why the mid-meridian gives the mean.
Exam tip: if a question gives the tracks of a straight line at two meridians, their difference is the chart convergency; divide it by the change of longitude to find n, and take the inverse sine to find the parallel of origin.
Frequently asked questions
What is the difference between a Mercator and a Lambert chart?
Both are conformal, so angles measured on them are true. On a Mercator the meridians are parallel, a straight line is a rhumb line and a great circle is a curve bowing towards the pole, and the scale expands rapidly with latitude. On a Lambert conformal conic the meridians converge, a straight line is very nearly a great circle, a rhumb line curves, and the scale is almost constant between the standard parallels.
Why are aeronautical charts conformal?
A conformal, or orthomorphic, chart has meridians and parallels crossing at right angles and, at any point, the same scale in every direction. Angles measured on the chart then equal angles on the Earth, so tracks and bearings can be read directly with a protractor. A chart cannot be both conformal and equal-area, so navigation charts accept distortion of area, and a scale that varies across the sheet, to keep directions true.
How do you calculate chart convergency on a Lambert chart?
Multiply the change of longitude by the constant of the cone, n, which is the sine of the parallel of origin. On a chart with its parallel of origin at 45°N, the meridians 010°E and 030°E converge by 20 × 0.707, about 14.1°. Unlike Earth convergency, this figure is the same wherever it is measured on the sheet, and it equals Earth convergency only at the parallel of origin.
How does scale change on a Mercator chart?
Scale on a Mercator chart expands with the secant of the latitude. It is correct at the equator, twice as large at 60° and almost six times as large at 80°, and the poles cannot be shown at all. A chart of 1:1 000 000 at the equator is therefore about 1:866 000 at 30° and 1:500 000 at 60°. Distances must be measured on the latitude scale at the mean latitude of the line.
Which chart projection is used in polar regions?
The polar stereographic projection. It is a plane touching the Earth at the pole, with meridians drawn as straight lines radiating from the pole and parallels as concentric circles. Its scale is correct at the pole and grows slowly away from it, its constant of the cone is 1, and great circles near the pole are almost straight lines, which suits polar grid navigation.
Test yourself on Chart Projections
The v1prep banks cover this topic in General and Radio Navigation (061/062), with a worked explanation for every answer. EASA ATPL, PPL, IR and CPL, the FAA written tests and A320/B737 type ratings.
Start practising →Sources and further reading
- ICAO Annex 4, Aeronautical Charts
- EASA, Explanatory Note to ED Decision 2018/001/R, Part-FCL theoretical knowledge learning objectives (061 General Navigation)
- FAA Pilot's Handbook of Aeronautical Knowledge (FAA-H-8083-25), Chapter 16, Navigation
- FAA Aeronautical Chart Users' Guide
- AIP France, GEN 3.2, Aeronautical Charts (3.2.8, corrections to the 1:500 000 ICAO chart)
Library articles are written for study and exam preparation. They do not replace your aircraft's approved documentation, your operator's procedures or the regulations themselves.