Ground Weather Radar and Satellite Imagery
Ground weather radar maps precipitation by the microwave energy it reflects, measured as reflectivity in dBZ. Weather satellites image cloud from orbit, in reflected sunlight by day and in infrared by day and night. Together they show where cloud and precipitation lie and how they are moving.
Ground weather radar and weather satellite imagery let meteorologists watch the weather as it happens over areas far larger than any network of observing stations can cover. A radar on the ground transmits microwave pulses and measures the energy returned by rain, snow and hail, so it maps precipitation and its intensity. A satellite looks down from orbit and records the sunlight reflected by cloud, or the heat that cloud tops and the surface give off, so it maps cloud.
For pilots both are planning tools. They show where thunderstorms, fronts, fog and the intertropical convergence zone lie before departure, and whether they are building, decaying or moving. Neither shows icing, turbulence or volcanic ash directly, and every image is already some minutes old when it is viewed. Tactical avoidance in flight belongs to the aircraft's own weather radar and to what the crew can see.
Ground-based weather radar and NEXRAD
A ground weather radar is a primary radar. It transmits short pulses from a rotating dish antenna and listens for echoes: the delay of each echo gives the range, the antenna azimuth gives the bearing and the strength of the echo gives the intensity of the precipitation. Sweeping through 360° at a series of increasing elevation angles, the radar builds up a three-dimensional picture of the precipitation around it. Modern weather radars also use the Doppler principle, measuring the frequency shift caused by precipitation moving towards or away from the antenna. That reveals rotation, gust fronts and microburst outflows, the job of the Terminal Doppler Weather Radars at major US airports (see windshear and microbursts).
In the United States the national network is NEXRAD (Next-Generation Weather Radar), made up of WSR-88D Doppler radars. Their scans are combined into regional and national mosaics, which reach pilots on the ground through briefing services and in the air through datalink, among others the FAA's Flight Information Service-Broadcast (FIS-B) to aircraft with ADS-B In. European meteorological services run their own national networks and publish composite images in the same way.
Radar has fixed limitations:
- It sees precipitation, not cloud. Cloud droplets are too small to return a useful echo, so cloud without precipitation, icing, clear air turbulence and volcanic ash do not appear.
- The beam rises with range. It widens with distance and, because the Earth curves away beneath it, passes ever higher above the ground. Far from the site it overshoots shallow showers and low-level rain, so echoes can be missing where precipitation is falling.
- Every image has an age. A composite is assembled after the scans that make it up, and the time it shows may be when it was assembled rather than when the oldest data were collected.
Reflectivity and dBZ
The strength of an echo is expressed as radar reflectivity, a measure of how much energy the targets in a volume of air scatter back to the antenna. It depends on the number of drops and above all on their size: reflectivity rises with about the sixth power of drop diameter, so a few large drops outweigh a great many small ones. It also depends on whether the water is liquid. Ice returns only about a fifth of the echo of a water drop of the same size, so the order of strength, from the strongest, is wet hail, heavy rain, wet snow, then dry hail, dry snow and ice crystals.
Because reflectivity spans an enormous range, it is given on a logarithmic scale in dBZ, decibels of reflectivity (Z), on which each step of 10 dBZ is a tenfold increase. The FAA's intensity terms, which controllers use when describing echoes, are tied to it:
| Reflectivity | FAA intensity term | Approximate rainfall rate |
|---|---|---|
| Below 30 dBZ | Light | Up to about 4 mm/h |
| 30 to 40 dBZ | Moderate | About 4 to 12 mm/h |
| 40 to 50 dBZ | Heavy | About 12 to 50 mm/h |
| Above 50 dBZ | Extreme | Above about 50 mm/h |
Colour scales differ between products, so the legend of each image has to be read; many follow the green, yellow, red and magenta order of airborne radar. Intensity is only an indicator. Reflectivity measures rain, and the hail, turbulence and windshear of a storm are inferred from it and from the shape of the echo.
Exam tip: radar sees water, not cloud. Wet hail gives the strongest return. Dry snow, ice crystals, cloud droplets, clear air turbulence and volcanic ash give little or nothing, so a clear radar picture does not mean clear air.
Radar signatures of severe storms
The shape of an echo, and the way intensity changes across it, often reveal more than its colour. Meteorological texts and weather radar manuals describe a set of patterns that point to strong updraughts, hail and turbulence, among them the radar hail signatures of hook, finger, U-shape and scalloped edge:
- Steep gradient: intensity rising from light to heavy over a short distance, the colours packed tightly together. Turbulence is most likely there.
- Hook: a hooked appendage curling out from the edge of a strong echo. On ground radar images the hook echo is the classic sign of a supercell, the storm built round a single rotating updraught, the mesocyclone. It marks a storm capable of large hail and tornadoes.
- Finger: a narrow protrusion reaching out from the main echo.
- U-shape: an echo, or part of one, curved into a U.
- Scalloped edge: an irregular, wavy outline in place of a smooth one.
- Rapid change: an echo that grows, changes shape or intensifies quickly from one image to the next.
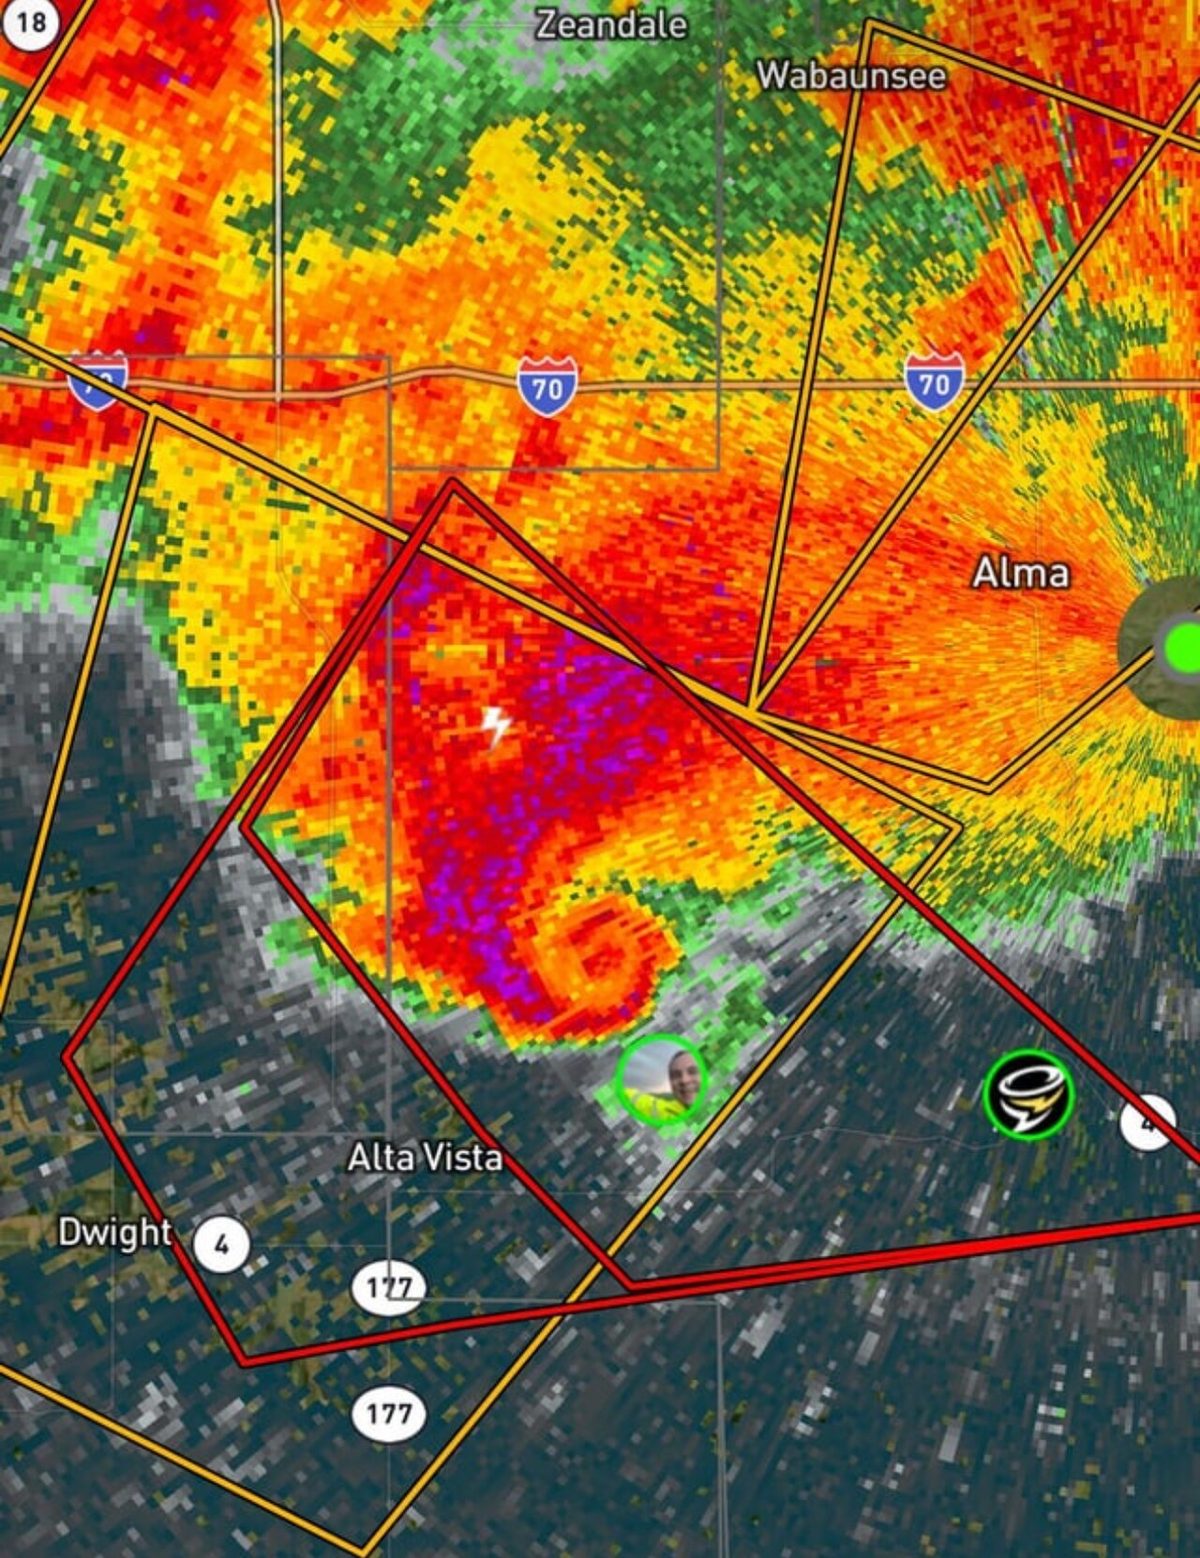
The avoidance criteria quoted in EASA exam material, from UK CAA guidance, apply these signatures. Below 20,000 ft, echoes showing hooks, fingers, scalloped edges, strong intensities, sharp gradients or rapid change should be avoided by 10 NM. Above 20,000 ft all echoes should be avoided by 20 NM, because the significance of an echo increases with altitude. The FAA AIM advises avoiding any storm identified as severe, or giving an intense radar echo, by at least 20 NM, and treats two such cells less than 40 NM apart as leaving no safe gap (see thunderstorms).
Geostationary and polar-orbiting satellites
Weather satellite imagery comes from two kinds of orbit, and the difference decides what each can show.
A geostationary satellite orbits above the equator at a height of about 36,000 km. At that height one orbit takes 24 hours, the same time as the Earth takes to turn, so the satellite stays over one longitude and watches the same disc of the Earth continuously. That gives frequent pictures of the same area, ideal for time-lapse sequences showing weather developing and moving. The penalty of the great height is lower picture definition, and towards the poles the surface is seen ever more obliquely, so the image is distorted and needs computer correction.
Meteosat is the European geostationary series, and the one EASA exam questions refer to. It covers about a third of the Earth's surface, from about 70° W to 70° E. The first-generation satellites sent a full-disc picture every 30 minutes and Meteosat Second Generation every 15 minutes. The United States operates the equivalent GOES series.
A polar-orbiting satellite, such as those of the US NOAA and Russian Meteor series, flies far lower, at about 820 to 870 km, in an orbit inclined at about 99° to the equator, taking about 1 hour 42 minutes per revolution. It images a strip about 1,500 NM wide, and because the Earth turns beneath the orbit, each pass lies a little further west than the one before. Successive strips overlap most near the poles and least near the equator.
| Geostationary | Polar-orbiting | |
|---|---|---|
| Height | About 36,000 km | About 820 to 870 km |
| Orbit | Over the equator, 24 hours | Inclined about 99°, about 1 h 42 min |
| Coverage | The same area, continuously | Strips about 1,500 NM wide, including the poles, at intervals |
| Definition | Lower, distorted towards the poles | Higher |
| Examples | Meteosat, GOES | NOAA, Meteor |
Visible and infrared imagery
Satellites image the Earth in several wavelength bands, or channels. Two matter most to pilots, and a third adds to them.
Visible satellite imagery records sunlight reflected by cloud and the surface, much like a black-and-white photograph from space. Cloud appears white, land grey and sea black, and thick cloud reflects more than thin, so brightness shows depth rather than height. It is the easiest image to interpret, and its limitation is obvious: it is not available at night.
Infrared satellite imagery records the heat radiated by cloud tops and the surface, which depends on their temperature, and it is displayed so that cold is bright and warm is dark. Because temperature falls with height through the troposphere, high, cold tops such as cumulonimbus and thick cirrus show brilliant white, low cloud a dull grey and warm land or sea dark. The shading is the same by day and by night, so infrared gives continuous coverage. Its weakness is near the surface: fog and low stratus have almost the same temperature as the ground or sea beneath and may be impossible to pick out. A visible image usually shows the fog clearly, one of the few cases where it has the advantage.
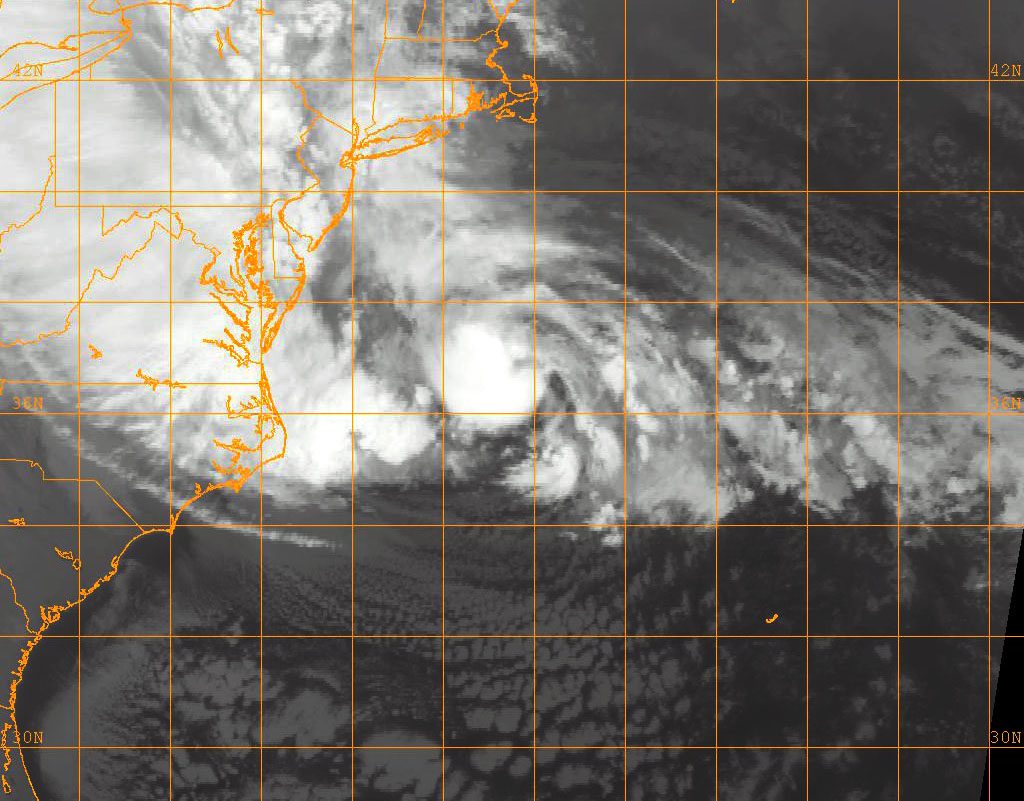
Viewed together, the two tell cloud types apart. Cloud bright in both is thick cloud with high, cold tops, typically cumulonimbus. Cloud bright in visible but grey in infrared is low cloud, stratus or fog. Water vapour imagery adds the moisture pattern of the middle and upper troposphere.
Exam tip: on infrared, white means cold and therefore high; on visible, white means thick. Infrared works at night but can miss fog; visible shows fog but only in daylight.
False-colour imagery
A satellite measures an intensity in each channel, naturally shown as shades of grey. False-colour imagery is produced by a computer that converts ranges of grey into different colours. It is used above all with infrared, where a colour scale separates cloud-top temperature bands the eye cannot tell apart in grey. The coldest tops, those of vigorous cumulonimbus, then stand out as a distinct colour instead of a slightly brighter white, which makes such enhanced images a quick way to find active convection.
The colours mean nothing beyond the scale printed with the image, and scales differ between providers. Because oceans and wide areas of cloud offer no landmarks, most satellite images also carry a computer-drawn graticule of latitude and longitude and enhanced coastlines, as in the infrared image above.
Using imagery in flight planning
Radar and satellite images complement each other and the forecasts. Used well in planning, they follow a simple routine:
- Check the time. Compare each image's time stamp with the planned time of flight, remembering that the picture is already some minutes old.
- Animate. A loop of successive images shows movement and development far better than a single frame: a line of cells advancing on the destination, fog burning off, or cloud tops growing colder as convection builds.
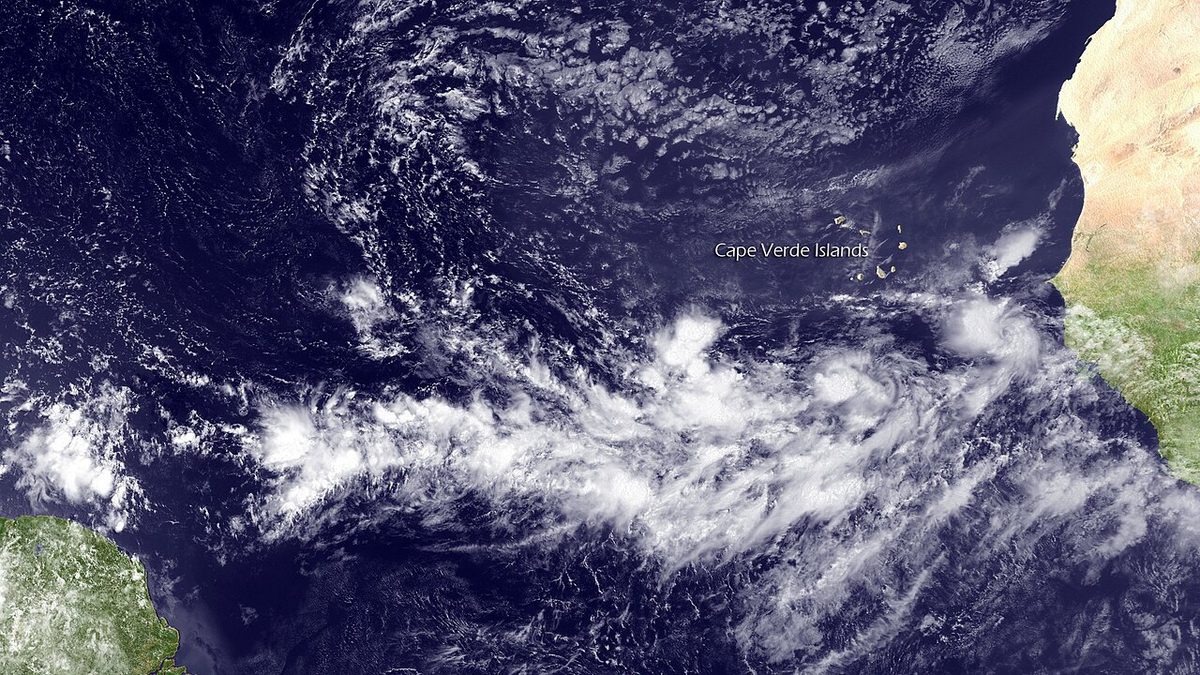
- Read the patterns. A long band of cloud marks a front. Bright, cold, rounded tops mark cumulonimbus. A broad east–west band of separate bright clusters over a tropical ocean is the intertropical convergence zone, where tops can exceed 50,000 ft.
- Combine sources. Satellite shows cloud, radar precipitation and lightning data active cells. TAFs, SIGMETs and significant weather charts add the forecast and the warnings. Volcanic ash advisory centres track ash with satellite images precisely because radar cannot see it (see volcanic ash).
- Plan wide. Build deviations and extra fuel into the plan rather than counting on finding gaps between cells.
In flight, datalink weather brings the same picture into the cockpit. In the United States, FIS-B broadcasts NEXRAD mosaics to aircraft with ADS-B In, and the AIM and FAA advisory material treat such images as strategic information only. The age displayed refers to when the mosaic was created, not to the radar scans within it, and the real delay can exceed 15 to 20 minutes, long enough for a gap between cells to close. They support decisions such as routing well clear of a line of storms, never manoeuvring between cells. Airborne weather radar shows the weather ahead as it is. A pilot without it, who cannot see and avoid storms visually, stays out of the area or waits for it to pass.
Warning: never use a datalink or downloaded radar image to pick a way through a line of thunderstorms. The image shows where the cells were, not where they are.
Frequently asked questions
What does dBZ mean on a weather radar image?
dBZ is the unit of radar reflectivity, a logarithmic scale on which every 10 dBZ is a tenfold increase in reflectivity. The FAA describes echoes below 30 dBZ as light, 30 to 40 dBZ as moderate, 40 to 50 dBZ as heavy and above 50 dBZ as extreme. Reflectivity measures precipitation, not cloud or turbulence, so storm hazards are inferred from it and from the shape of the echo.
What is the difference between visible and infrared satellite images?
A visible image records sunlight reflected by cloud and the surface, so it only works in daylight; thick cloud is brightest, land grey and sea black. An infrared image records the heat given off, displayed so that cold is bright. High, cold cloud tops such as cumulonimbus show white by day and night, but fog and low stratus, being as warm as the ground beneath, can be hard to see.
What is the difference between a geostationary and a polar-orbiting weather satellite?
A geostationary satellite orbits about 36,000 km above the equator once every 24 hours, so it watches the same area continuously, but with lower definition and a distorted view near the poles. A polar-orbiting satellite flies at about 820 to 870 km in an orbit inclined at about 99 degrees, giving sharper images of strips about 1,500 NM wide, including the poles, but seeing each place only at intervals.
What is a hook echo on weather radar?
A hook echo is a hooked appendage curling out from the edge of a strong thunderstorm echo. On ground radar images it is the classic sign of a supercell, the storm built round a single rotating updraught, and marks a severe storm capable of large hail and tornadoes. Hooks, fingers, U-shapes and scalloped edges on any radar are all signs of hail and strong updraughts and call for wide avoidance.
Can pilots use NEXRAD or datalink radar images to fly between thunderstorms?
No. Datalink radar images such as FIS-B NEXRAD mosaics are assembled from several radar scans, and the age shown is when the mosaic was made, not when the data were collected. The real delay can exceed 15 to 20 minutes, long enough for a gap between cells to close. FAA guidance treats them as strategic tools for avoiding a whole area; tactical avoidance needs airborne weather radar or visual contact.
Test yourself on Ground Weather Radar and Satellite Imagery
The v1prep banks cover this topic in Meteorology (050), with a worked explanation for every answer. EASA ATPL, PPL, IR and CPL, the FAA written tests and A320/B737 type ratings.
Start practising →Sources and further reading
- FAA-H-8083-28B, Aviation Weather Handbook
- FAA Aeronautical Information Manual, Chapter 7, Section 1 (weather radar services, FIS-B, thunderstorm flying)
- FAA InFO 07008, Weather radar echo intensity terminology
- Airbus Safety First, Optimum Use of the Weather Radar
- EASA, Explanatory Note to ED Decision 2018/001/R, Part-FCL theoretical knowledge learning objectives
Library articles are written for study and exam preparation. They do not replace your aircraft's approved documentation, your operator's procedures or the regulations themselves.