Significant Weather and Graphical Forecasts
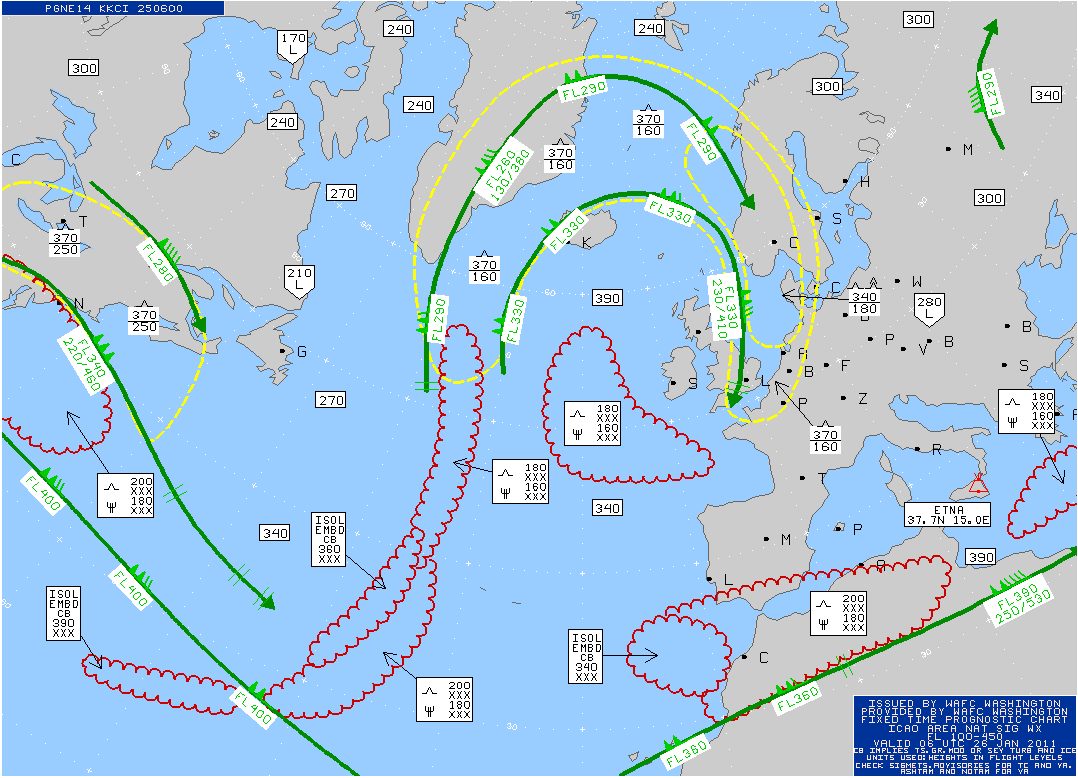
A significant weather (SIGWX) chart is a fixed-time forecast chart showing the weather hazardous to flight, such as jet streams, turbulence, icing, cumulonimbus and low cloud, over a band of levels. Graphical forecasts such as the FAA's GFA present the same kind of information as interactive layers.
Text forecasts are good at saying what will happen at a place; charts are better at showing where the hazards lie along a route. Significant weather charts and the graphical products that have grown out of them put the jet streams, turbulence, icing, storms and low cloud on a map, so that a pilot can see at a glance which parts of the route and which levels to avoid.
Under ICAO Annex 3 these charts come in two families: high-level charts for airliner cruising levels, produced for the whole world by the World Area Forecast Centres, and low-level charts for light aircraft, produced by each state. The United States adds its own interactive products, above all the Graphical Forecasts for Aviation (GFA), together with flight categories and convective outlooks that US examinations cover in detail.
- Prognostic and fixed-time charts
- High-level significant weather charts
- Low-level significant weather charts
- UK Form 215 and 415
- Graphical Forecasts for Aviation and area forecasts
- Ceiling and visibility analysis
- Flight categories: VFR, MVFR, IFR and LIFR
- Using the charts in planning
- Convective outlooks
- Frequently asked questions
Prognostic and fixed-time charts
An analysis chart shows the weather as observed at a given time. A prognostic chart, or prog, shows the weather forecast for a later time. Almost every significant weather chart is a prog.
Most are also fixed-time charts: they show the situation at a single moment, such as 1200 UTC, and not over a period as a TAF or a GAMET does. WAFS significant weather charts are issued every 6 hours, usually 18 to 24 hours before their valid time. A flight at 1500 UTC therefore falls between the 1200 and 1800 UTC charts, and the pilot has to interpolate, allowing for the movement of fronts, jets and storm areas in between.
Exam tip: a fixed-time chart is valid only at the time printed on it. It says nothing about when a hazard starts or ends; that is what warnings and period forecasts are for.
High-level significant weather charts
The high-level SIGWX chart is produced by the two World Area Forecast Centres, London and Washington (see meteorological services and briefings). It covers the levels used by jet transport, from FL250 up to FL600; older charts and much exam material give the top as FL630. The WAFCs also issued medium-level charts for FL100 to FL450 for limited regions. Since late 2024 they have also issued a new-generation WAFS SIGWX forecast as a single data set from FL100 to FL600.

All heights on the chart are flight levels, and wind speeds are in knots. The main features and their symbols:
| Feature | How it is drawn |
|---|---|
| Jet stream | Heavy line with an arrowhead, starting and ending where the forecast wind reaches 80 kt; at each speed maximum a wind symbol (pennant 50 kt, barb 10 kt) with the core flight level |
| Jet depth | Where the core reaches 120 kt, the levels of the 80 kt isotach below and above the core |
| Change of core speed | Double bar across the jet line for each 20 kt change |
| Clear air turbulence | Area bounded by a heavy dashed line, labelled with a number in a square box that refers to a legend giving intensity and levels, such as moderate, FL240 to FL360 |
| Tropopause | Flight level in a rectangular box, for example 350; a boxed H or L marks a local high or low point |
| Cumulonimbus | Outlined area labelled with its coverage (ISOL, OCNL, FRQ) or EMBD, and its base and top |
On these charts ISOL means individual cumulonimbus covering less than 50 % of the area, OCNL well-separated cells over 50 to 75 %, and FRQ little or no separation over more than 75 %. EMBD means the cells are embedded in layer cloud and cannot be seen. By convention a cumulonimbus area also implies hail, moderate or severe turbulence and moderate or severe icing, which are not drawn separately.
The chart shows where the problems were expected when it was drawn; the SIGMETs in force give the latest picture. A crew reads both, together with the upper wind charts for the jet's position and speed (see jet streams).
Low-level significant weather charts
Light aircraft need a different chart. The ICAO low-level significant weather chart typically covers the surface to FL100 and is produced by each state's meteorological service, alongside or instead of the GAMET area forecast. It gives, area by area, the visibility and weather, the cloud, the freezing level and hazards such as icing and turbulence.
On these low-level charts cloud bases and tops are in feet above mean sea level unless marked otherwise, not above ground, because the pilots who use them compare them with terrain heights, minimum safe altitudes and the freezing level, all given above sea level. XXX in place of a cloud top means the cloud extends above the top of the chart.
UK Form 215 and 415
The United Kingdom's low-level chart is Form 215, known as F215, with Form 415 as its night version. Wavy lines divide the chart into lettered areas, subdivided as B1, B2 and so on when conditions change only slightly within them. For each area a table at the side gives the surface visibility, weather, cloud and the altitude of the 0 °C isotherm.
Form 215 uses its own coverage definitions:
| Term | Coverage | Meaning |
|---|---|---|
| ISOL | Less than 25 % | Easily avoided |
| OCNL | 25 to 50 % | Can be avoided |
| FRQ | More than 50 % | Little separation, difficult to avoid; convective phenomena only |
| WDSPR | More than 50 % | Difficult to avoid; convective or not |
Warning: OCNL on Form 215 means 25 to 50 % of the area; on a WAFS chart it means 50 to 75 %. Read the percentages from the chart in use.
Form 214 and 414 are the companion spot wind and temperature charts (see surface and upper air charts). France publishes its equivalent as the TEMSI chart, a fixed-time chart of the significant weather and cloud masses for low-level flights. French AIRMET information is communicated in the form of TEMSI charts, and in metropolitan France these low-level area forecast charts are issued every 3 hours from 0600 to midnight UTC, a difference from Annex 3 recorded in the French AIP (see SIGMET, AIRMET and weather warnings).
Graphical Forecasts for Aviation and area forecasts
Under ICAO rules the area forecast for low-level flights is issued either as text, the GAMET, or as a chart. The United States long used its own text area forecast (FA), a regional description of clouds and weather. In 2017 it was replaced for the lower 48 states by the Graphical Forecasts for Aviation (GFA) on aviationweather.gov. Text area forecasts remain for Alaska, Hawaii, the Gulf and the Caribbean.
The GFA is an interactive map. Its forecast tab offers layers for clouds and ceiling, visibility, precipitation and weather, thunderstorms, icing, turbulence, winds and temperatures, with a time slider from the current hour to 15 hours ahead; it is updated hourly. The observation tab overlays METARs, PIREPs, radar and satellite pictures. It also colours each airport by flight category, so the pattern of VFR, MVFR, IFR and LIFR along a route shows at a glance.
The United States also issues a low-level significant weather prognostic chart, the low-level prog, covering the surface to FL240 for 12 and 24 hours ahead:
- IFR and MVFR areas are outlined, with the line styles and colours given in the legend;
- areas of moderate or greater turbulence are enclosed by dashed lines, with top and base in hundreds of feet MSL: 240/120 means 12,000 to 24,000 ft, and a top with no base means from the surface or below the chart's lower limit up to that top;
- the freezing level is drawn as dashed contours labelled in hundreds of feet, with SFC where it reaches the ground.
The GFA and the separate freezing level graphics show the lowest altitude of the 0 °C isotherm in the same way. Where a warm layer aloft lies over sub-zero air near the ground, a freezing-level contour appears inside the area where the surface is already below freezing. That marks multiple freezing levels, the profile that produces freezing rain or ice pellets at the surface and severe clear ice aloft (see airframe icing).
Ceiling and visibility analysis
Between airports there are no observations, and a US TAF covers only the area within 5 SM of the airport. The Ceiling and Visibility Analysis (CVA) fills the gaps: it combines surface observations with satellite cloud data into a gridded estimate of ceiling and visibility, updated every few minutes. It shows whether low conditions are widespread or local, but it interpolates rather than measures, and it does not forecast. For a flight that will arrive later, it is used with the TAFs and the GFA.
Flight categories: VFR, MVFR, IFR and LIFR
US weather displays, including the GFA and METAR and TAF maps, group conditions into four flight categories. The ceiling and the visibility are assessed separately and the worse of the two sets the category.
| Category | Ceiling | Visibility | Display colour |
|---|---|---|---|
| LIFR, low IFR | Below 500 ft | Below 1 SM | Magenta |
| IFR | 500 to below 1,000 ft | 1 to below 3 SM | Red |
| Marginal VFR (MVFR) | 1,000 to 3,000 ft | 3 to 5 SM | Blue |
| VFR | Above 3,000 ft | Above 5 SM | Green |
These are planning categories, not legal minima: the legal VFR minima are in 14 CFR 91.155 and the approach minima on the chart. ICAO and EASA rules define no equivalent categories; European pilots compare the forecasts directly with the VMC minima of SERA and their own limits (see cloud cover and ceiling).
Using the charts in planning
A chart is read against the flight, not on its own. The first check is time: which chart, or which pair of charts, brackets the time the aircraft will be over each part of the route. The second is level.
- High level. Compare the jet core, the clear air turbulence boxes and the cumulonimbus tops with the planned cruise levels. The worst turbulence near a jet is usually on its cold, low-pressure side, and a cumulonimbus top at or above the cruise level means a deviation, not a climb.
- Low level. Set the freezing level, the icing layer and the cloud base against the minimum safe altitudes. With a freezing level of 5,000 ft, moderate icing in cloud from there up to tops at FL120 and a minimum en route altitude of 7,000 ft, an aeroplane without ice protection has no usable level in cloud on that route: every level from the minimum en route altitude up to the tops lies inside the icing band.
- Currency. A chart is hours old by the time it is used. SIGMETs, AIRMETs, the latest METARs and TAFs and pilot reports show whether the weather is following the forecast, and they take precedence where they differ.
Convective outlooks
The Convective Outlook (AC) from the Storm Prediction Center is a planning product covering the contiguous United States. For days 1 to 3 it outlines where thunderstorms are expected and grades the risk of severe storms in six categories: general thunderstorms (TSTM), marginal, slight, enhanced, moderate and high. Days 4 to 8 are given as probabilities. Day 1 is updated several times a day.
An enhanced risk means numerous severe storms are possible, a strong reason to plan alternatives, but the outlook is not a warning of storms in progress. On the day of the flight, pilots turn to the GFA thunderstorm layer, convective SIGMETs, radar and satellite (see thunderstorms).
Frequently asked questions
What is shown on a high-level significant weather chart?
The WAFS high-level SIGWX chart, which now covers FL250 to FL600, shows jet streams with their core level and speed, areas of moderate or severe clear air turbulence, areas of cumulonimbus with their coverage, base and top, and the height of the tropopause in boxes. Heights are flight levels, and the chart is valid only at the time printed on it.
What does a fixed-time chart mean?
A fixed-time chart shows the forecast situation at one moment, such as 1200 UTC, not over a period. WAFS SIGWX charts are fixed-time charts issued every 6 hours, usually 18 to 24 hours ahead. For a flight between two valid times the pilot interpolates between the charts, allowing for the movement of fronts, jets and storm areas in between.
What are the flight categories VFR, MVFR, IFR and LIFR?
They are US planning categories based on ceiling and visibility together, the worse of the two deciding. LIFR is a ceiling below 500 ft or visibility below 1 SM; IFR is 500 to below 1,000 ft or 1 to below 3 SM; MVFR is 1,000 to 3,000 ft or 3 to 5 SM; VFR is above 3,000 ft and 5 SM. Displays colour them magenta, red, blue and green. They are not legal minima.
What replaced the FAA area forecast (FA)?
In 2017 the Graphical Forecasts for Aviation (GFA) on aviationweather.gov replaced the text area forecast for the contiguous United States. The GFA shows clouds and ceilings, visibility, precipitation, thunderstorms, icing, turbulence and winds as selectable layers, updated hourly and running out to 15 hours, with an observation tab for METARs, PIREPs, radar and satellite. Text area forecasts continue for Alaska, Hawaii, the Gulf and the Caribbean.
What is the difference between OCNL CB on a WAFS chart and on UK Form 215?
The same word covers different amounts. On WAFS significant weather charts ISOL means less than 50 per cent of the area, OCNL 50 to 75 per cent and FRQ more than 75 per cent. On the UK low-level Form 215 ISOL is less than 25 per cent, OCNL 25 to 50 per cent and FRQ or WDSPR more than 50 per cent. Always read the percentages from the chart in use.
Test yourself on Significant Weather and Graphical Forecasts
The v1prep banks cover this topic in Meteorology (050), with a worked explanation for every answer. EASA ATPL, PPL, IR and CPL, the FAA written tests and A320/B737 type ratings.
Start practising →Sources and further reading
- ICAO Annex 3, Meteorological Service for International Air Navigation
- NOAA Aviation Weather Center, High Level SigWx Chart Help
- NOAA Aviation Weather Center, Graphical Forecasts for Aviation (GFA)
- NOAA Storm Prediction Center, Convective Outlooks
- FAA-H-8083-28B, Aviation Weather Handbook (forecast charts and graphical products)
- FAA Aeronautical Information Manual, Chapter 7, Section 1 (Meteorology)
- AIP France, ENR 1.1, General Rules (1.1.8, TEMSI charts and AIRMET information)
Library articles are written for study and exam preparation. They do not replace your aircraft's approved documentation, your operator's procedures or the regulations themselves.