Atmospheric Stability
Atmospheric stability is the tendency of air that has been displaced vertically either to return to its original level (stable air) or to keep moving away from it (unstable air). It is judged by comparing the environmental lapse rate with the dry and saturated adiabatic lapse rates.
Atmospheric stability describes how the air responds when part of it is pushed up or down. In stable air a displaced parcel returns to where it started; in unstable air it keeps going, and small disturbances grow into convection, cumulus and thunderstorms. Stability is not a property of the air on its own but the result of a comparison: the temperature a rising parcel takes on, fixed by physics, against the temperature of the air around it, set by the day's weather.
Stability decides the character of the weather: layer cloud or heap cloud, continuous rain or showers, smooth air in haze or turbulent air with good visibility. Forecasters read it every day from upper-air soundings.
Adiabatic processes
An adiabatic process is a change of temperature produced by compression or expansion alone, with no heat added or removed from outside. Pressure falls with height, so a rising parcel of air expands and cools, and a sinking parcel is compressed and warms. The parcel is assumed not to mix with its surroundings, which is close enough to the truth for the purpose.
Non-adiabatic processes, such as solar heating of the ground, radiative cooling at night and the advection of warmer or colder air, change the temperature of the environment instead, and so decide the stability of the day.
Lapse rates: ELR, DALR and SALR
A lapse rate is the rate at which temperature falls with height. Three are needed, and confusing them is the commonest error in this subject.
The environmental lapse rate (ELR) is the actual temperature profile of the atmosphere at a given place and time, as measured by radiosonde ascents. It is not a rate at which any air cools: it is a snapshot of air at rest, and it changes from day to day and hour to hour. The International Standard Atmosphere uses a fixed average of 0.65 °C per 100 m (1.98 °C per 1,000 ft, usually rounded to 2 °C) up to 11 km, but that is a reference for altimetry and performance, not a picture of the real profile.
The dry adiabatic lapse rate (DALR) is the rate at which unsaturated air cools as it rises: 1 °C per 100 m, or about 3 °C (5.4 °F) per 1,000 ft. It is constant, because nothing condenses to add heat, and sinking air warms at the same rate.
The saturated adiabatic lapse rate (SALR) applies once rising air is saturated and cloud is forming. Condensation releases latent heat into the parcel and offsets part of the cooling, so the SALR is always less than the DALR (see humidity and water vapour). It is not constant: the more vapour condenses, the more heat is released, so the SALR is lowest in warm, moist air and increases with altitude and latitude, approaching the DALR in very cold air.
| Rate | Value | Applies to |
|---|---|---|
| DALR | 1 °C per 100 m, about 3 °C per 1,000 ft | Unsaturated air rising or sinking; constant |
| SALR | Variable. EASA ATPL texts: about 0.6 °C per 100 m (1.8 °C per 1,000 ft) near the surface in temperate latitudes. PPL, CPL and IR questions often round it to 1.5 °C per 1,000 ft; FAA material gives about 1.2 to 1.5 °C per 1,000 ft | Saturated rising air; lower in warm air, higher in cold air |
| ISA | 0.65 °C per 100 m, 1.98 °C per 1,000 ft | A fixed reference profile, not real air |
The different SALR figures are not rival values but approximations of one variable rate, quoted for different conditions. What matters for a stability question is where the ELR lies relative to the DALR and the SALR, so use the SALR figure the question gives.
Exam tip: Never apply the ISA rate to a rising parcel, or the DALR to the air at rest. A parcel lifted 3,000 ft from +20 °C without saturating arrives at +11 °C, whatever the surrounding air is doing.
Stable, unstable and neutral air
Stability is tested by imagining a parcel lifted a short distance and comparing its temperature with the environment at the new level. If it is colder, it is denser and sinks back: the air is stable. If it is warmer, it keeps rising: the air is unstable. Because the parcel cools at the DALR or the SALR, the test reduces to comparing the ELR with those two rates.
- Absolute stability: the ELR is less than the SALR. Dry or saturated, a lifted parcel ends up colder than its surroundings and returns. An ELR of 0.4 °C per 100 m is an example.
- Absolute instability: the ELR is greater than the DALR. Dry or saturated, a lifted parcel stays warmer than its surroundings and keeps rising. An ELR of 1.2 °C per 100 m is an example; such profiles occur mainly in a strongly heated layer next to the ground on a hot afternoon.
- Neutral stability: the ELR equals the DALR for unsaturated air, or the SALR for saturated air. A displaced parcel keeps the temperature of its surroundings and stays wherever it is put.
- Conditional instability: the ELR lies between the two, as described below.
A worked example from FAA material: with 20 °C at the surface and an ELR of 3.5 °C per 1,000 ft, an unsaturated parcel lifted 2,000 ft cools to 14 °C while the surrounding air is at 13 °C. The parcel is warmer and goes on rising: the air is unstable.
An isothermal layer, with temperature constant with height, and an inversion, with temperature rising with height, are extreme forms of stability: a rising parcel quickly becomes colder than its surroundings and stops. Such layers cap convection, flatten cloud tops and trap haze beneath them (see temperature inversions).
Stability changes as the profile changes. Heating the bottom of a layer, by sunshine on the ground or by cold air moving over a warmer surface, steepens the ELR and destabilises it; so does cooling aloft. Cooling the bottom, by radiation at night or by warm air moving over a colder surface, and warming aloft, as in subsidence, make the ELR shallower and stabilise the air.
Conditional instability
When the DALR is greater than the ELR, and the ELR greater than the SALR, the air is conditionally unstable, and the condition is saturation. A dry parcel lifted from the surface cools at the DALR, faster than its environment, and soon becomes colder than its surroundings: the air is stable. If it is lifted far enough to reach its condensation level, it then cools only at the SALR, more slowly than its environment, and at some height becomes warmer than its surroundings. From that level of free convection it rises of its own accord, and cloud can build through a great depth.
Typical examples are an ELR of 0.8 °C per 100 m, or 2 to 2.5 °C per 1,000 ft. Measured against these textbook rates, the ISA profile itself, at 1.98 °C per 1,000 ft, lies between the dry rate and the temperate saturated rate, so the standard atmosphere is conditionally unstable in its lower levels. That is why the same morning sounding can give a quiet morning and a showery or thundery afternoon: all that is missing is a trigger to lift the air to saturation, such as surface heating, high ground or a front.
Exam tip: "Conditional stability" is not a meteorological term. If it appears as an answer option in an EASA exam it can be discarded; the correct term is conditional instability.

Convection, thermals and subsidence
Convection is the vertical transport of air and heat by rising warm air; horizontal transport is advection. Over land on a sunny day the ground heats the air in contact with it, the lowest layer becomes unstable, and air rises in thermals, columns or bubbles of warm air separated by areas of sinking air. Thermal turbulence is strongest around 1500 local time on clear, sunny days. A thermal that reaches its condensation level is capped by a cumulus; in drier air thermals rise without cloud. Convection driven by surface heating dies away at night, and its cumulus evaporates.
Over the open sea the surface temperature changes by less than 1 °C between day and night, so daytime heating does not drive convection there. Cold air crossing a warmer sea is heated from below and becomes unstable, however, which is why a polar maritime airstream brings cumulus, cumulonimbus and showers, with good visibility between them.
Subsidence is the slow sinking of air over a wide area, typical of anticyclones and ridges. The sinking air warms adiabatically and its relative humidity falls, dispersing cloud, and it often forms a subsidence inversion that makes the lower layers stable. In winter, fog, haze and smoke can persist beneath it for days.
The föhn effect shows the adiabatic rates at work: moist air forced over a range cools at the SALR once cloud forms and rains out on the windward side, then warms at the DALR all the way down the lee, arriving warmer and drier (see local winds).
Upper-air soundings and thermodynamic diagrams
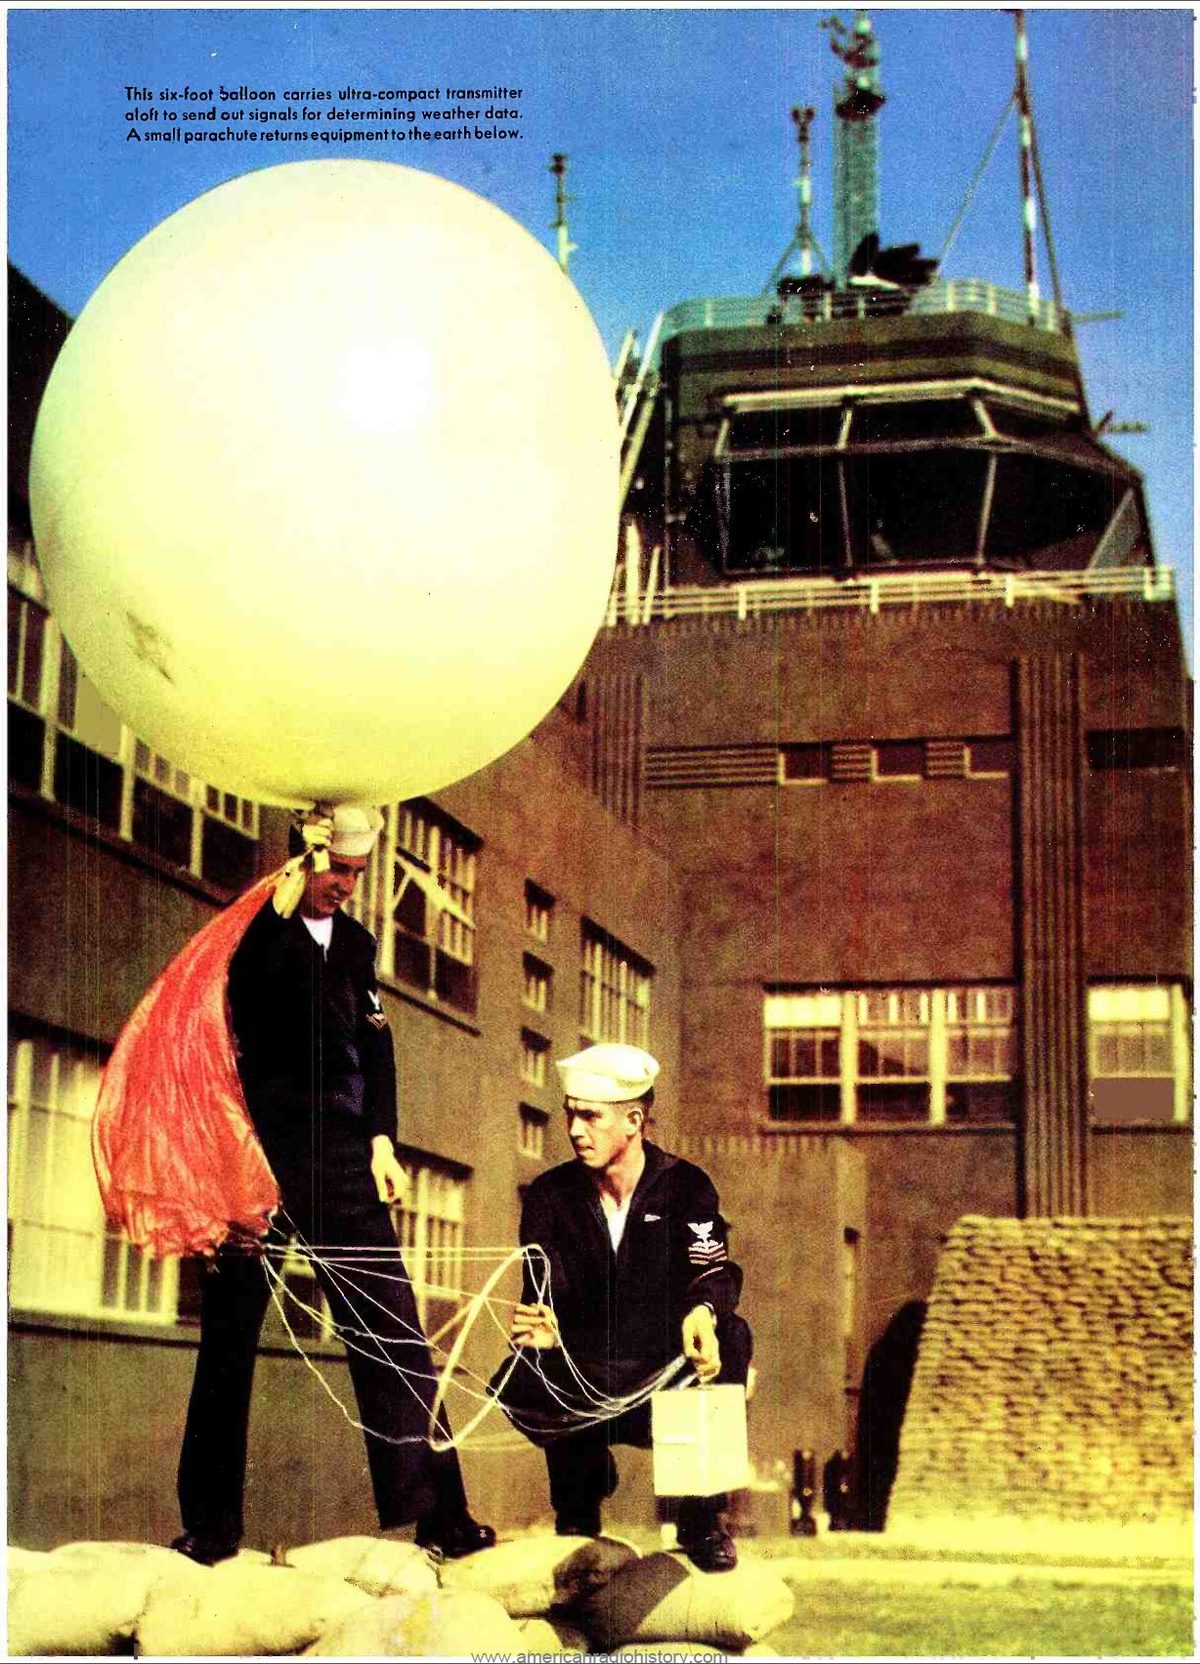
The ELR is measured by an atmospheric sounding, or temperature sounding. The standard tool is the radiosonde, an instrument package carried aloft by a balloon, which transmits pressure, temperature and humidity as it rises; tracking it gives the wind. A worldwide network releases radiosondes at the main synoptic times of 0000 and 1200 UTC.
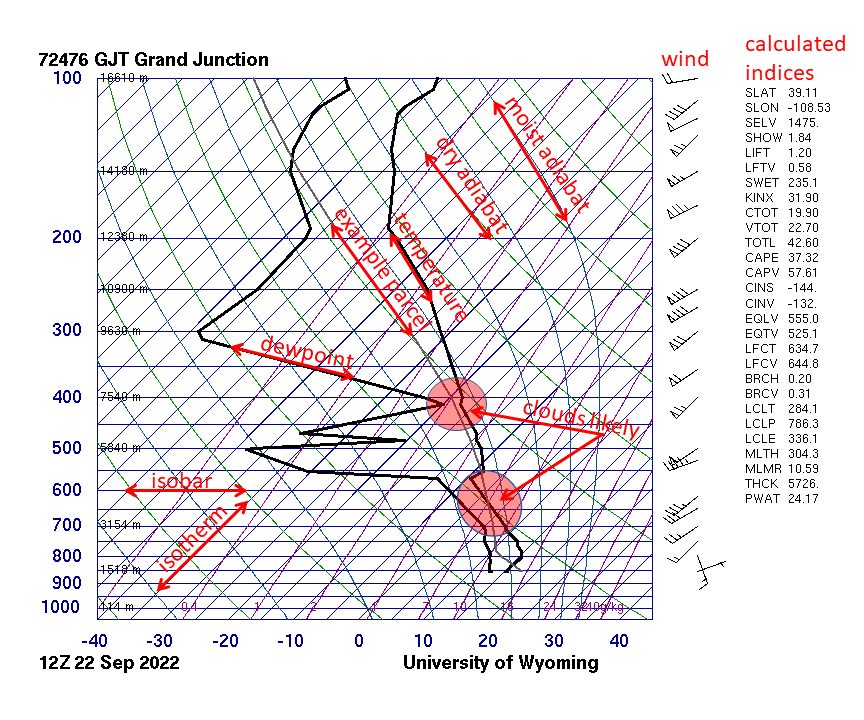
A sounding is plotted on a thermodynamic diagram, on which isotherms, isobars, dry adiabats, saturated adiabats and mixing ratio lines are printed as a background grid. Two diagrams dominate:
- The tephigram, used in the UK and in much EASA training material.
- The Skew-T log-P diagram, standard in the United States, with pressure on a logarithmic vertical scale and the isotherms skewed across it.
On both, comparing the slope of the temperature curve, the ELR, with the printed adiabats shows at a glance whether each layer is stable, conditionally unstable or unstable. Where the temperature and dew point curves come together the air is saturated, marking cloud layers; where the temperature curve crosses 0 °C is the freezing level; a saturated layer between 0 and −20 °C warns of icing; and an inversion shows as a temperature curve that turns towards warmer values with height.
Condensation level and cloud base
The condensation level is the height at which rising air has cooled to its dew point. Any further ascent produces condensation, so the condensation level marks the cloud base (see cloud formation and types). On a thermodynamic diagram two cases are distinguished:
- For air forced upwards, by high ground or a front, the parcel's temperature follows the dry adiabat from the surface temperature, while its dew point follows the mixing ratio line through the surface dew point, because its moisture content does not change. The lifting condensation level is where they meet.
- For air rising by convection from heated ground, the convective condensation level (CCL) is where the mixing ratio line through the surface dew point meets the ELR. It is the base of cumulus formed by surface heating.
The critical temperature, or convective temperature, is the surface air temperature needed for convection to carry air up to its condensation level, found by following the dry adiabat down from the CCL to the surface. When the forecast maximum reaches it, cumulus can be expected.
Without a diagram, convective cloud base estimation uses the surface spread. A rising unsaturated parcel cools at about 3 °C per 1,000 ft while its dew point falls at about 0.5 °C per 1,000 ft, so they converge at about 2.5 °C per 1,000 ft, or 400 ft for each degree of spread:
- Temperature +21 °C, dew point +11 °C: spread 10 °C, base about 4,000 ft above the surface.
- Temperature +22 °C, dew point +13 °C: spread 9 °C, base about 3,600 ft.
With Fahrenheit readings the FAA divides the spread by 4.4: 75 °F and 53 °F give a base near 5,000 ft. The answer is a height above the aerodrome; add the elevation for an altitude. The rule applies to convective cloud in a well-mixed layer, not to stratus or frontal cloud.
Weather in stable and unstable air
| Stable air | Unstable air | |
|---|---|---|
| Cloud | Stratiform, of large horizontal and small vertical extent, or clear skies | Cumuliform, of large vertical and small horizontal extent |
| Precipitation | Light, continuous or intermittent | Showers, moderate to heavy; hail and thunder from cumulonimbus |
| Visibility | Moderate to poor, in haze, mist or fog | Good, except in showers |
| Turbulence | Light, except near inversions and in mountain waves | Turbulent, especially in and below convective cloud |
| Airframe icing | Mostly rime from small droplets, often over long distances | Clear ice from large supercooled droplets |
Stable air is not always smooth: windshear can occur where the wind changes across an inversion, and a stable layer near summit level is one of the conditions for mountain waves, whose rotors can be violent. Unstable air, for its part, needs moisture and a trigger: a thunderstorm requires deep instability, enough moisture and a lifting mechanism together.
Frequently asked questions
What is the difference between stable and unstable air?
In stable air a parcel pushed upwards becomes colder and denser than its surroundings and sinks back, so vertical motion is damped. In unstable air the lifted parcel stays warmer than its surroundings and keeps rising. Stable air gives layer cloud, steady precipitation, smooth air and poor visibility; unstable air gives cumulus and cumulonimbus, showers, turbulence and good visibility outside the showers.
What is conditional instability?
Air is conditionally unstable when its environmental lapse rate lies between the saturated and dry adiabatic lapse rates. An unsaturated parcel cools faster than its surroundings and sinks back, so the air is stable while it stays dry. Once lifted to its condensation level, the parcel cools at the slower saturated rate, becomes warmer than its surroundings and rises freely. The condition is saturation, and a trigger is needed to reach it.
Why is the saturated adiabatic lapse rate lower than the dry rate?
Rising air cools by expansion. In unsaturated air nothing offsets this, so it cools at about 3 °C per 1,000 ft. In saturated air, water vapour condenses as the air cools and releases latent heat into the parcel, which partly offsets the cooling. The saturated rate is therefore smaller, and it is smallest in warm, moist air, where the most vapour condenses.
How do you estimate the base of cumulus cloud from the temperature and dew point?
Rising unsaturated air cools at about 3 °C per 1,000 ft while its dew point falls at about 0.5 °C per 1,000 ft, so the two converge at about 2.5 °C per 1,000 ft. Multiply the surface temperature-dew point spread by 400 ft: a spread of 10 °C gives a cumulus base near 4,000 ft above the surface. With Fahrenheit readings, divide the spread by 4.4 and multiply by 1,000 ft.
What is a tephigram used for?
A tephigram is a thermodynamic diagram on which a radiosonde sounding is plotted against a printed grid of isotherms, isobars, dry and saturated adiabats and mixing ratio lines. Forecasters and pilots use it to judge the stability of each layer, find cloud bases and tops, the freezing level and inversions, and estimate the condensation level and the surface temperature needed for convection. In the United States the Skew-T log-P diagram does the same job.
Test yourself on Atmospheric Stability
The v1prep banks cover this topic in Meteorology (050), with a worked explanation for every answer. EASA ATPL, PPL, IR and CPL, the FAA written tests and A320/B737 type ratings.
Start practising →Sources and further reading
- FAA Pilot's Handbook of Aeronautical Knowledge (FAA-H-8083-25), Chapter 12, Weather Theory
- FAA-H-8083-28B, Aviation Weather Handbook
- FAA Advisory Circular AC 00-6B, Aviation Weather (cancelled, superseded by FAA-H-8083-28)
- EASA, Explanatory Note to ED Decision 2018/001/R, Part-FCL theoretical knowledge learning objectives
Library articles are written for study and exam preparation. They do not replace your aircraft's approved documentation, your operator's procedures or the regulations themselves.