Primary Flight Display
The primary flight display (PFD) is the electronic screen in front of each pilot that combines attitude, airspeed, altitude, vertical speed, heading and autoflight mode information in one picture: an attitude display with a pitch ladder in the centre and moving speed and altitude tapes on either side.
The primary flight display (PFD) is the screen directly in front of each pilot that shows what is needed to control the aircraft: attitude, airspeed, altitude, vertical speed and heading, with the flight director commands and the flight mode annunciations. It replaced the attitude director indicator and the dials around it, and it is where the instrument scan now takes place.
The PFD keeps the logic of the basic T, with attitude in the centre, speed on the left and altitude on the right, but shows speed and altitude on moving tapes and adds trends, limit bands and targets that no mechanical instrument could carry. The principles are the same on a Garmin G1000 in a trainer and on an airliner. The examples below use the Boeing 737 NG and the Airbus A320; the system behind the screen is described under EFIS.
PFD layout
The PFD grew out of the electronic attitude director indicator (EADI) of the first EFIS installations. The EADI combined the attitude display with the flight director command bars, the radio altitude and the decision height marker. On a classic EADI the decision height is a magenta marker on the radio altitude scale that flashes and turns amber when the aircraft reaches it, until the pilot resets it. The PFD then added the speed and altitude tapes and a heading scale, so one screen replaces the whole basic T.
| Area | What it shows |
|---|---|
| Centre | Attitude: horizon, pitch ladder, bank scale, fixed aircraft symbol, flight director bars, flight path vector when selected |
| Left | Speed tape: current and selected speed, speed trend, limit bands, reference speed bugs, Mach number |
| Right | Altitude tape: current and selected altitude, barometric setting, minimums; vertical speed scale beside it |
| Bottom | Heading scale with the selected heading; on light-aircraft PFDs a full horizontal situation indicator |
| Top | Flight mode annunciator: autothrottle, roll and pitch modes, autopilot and flight director status |
| Around the attitude | ILS localiser and glideslope deviation scales, marker beacons, radio altitude, TCAS and GPWS alerts |
The flight mode annunciator is the only place that states which guidance modes are actually flying the aircraft, which is why it is read after every mode change (see flight director and autoflight modes).
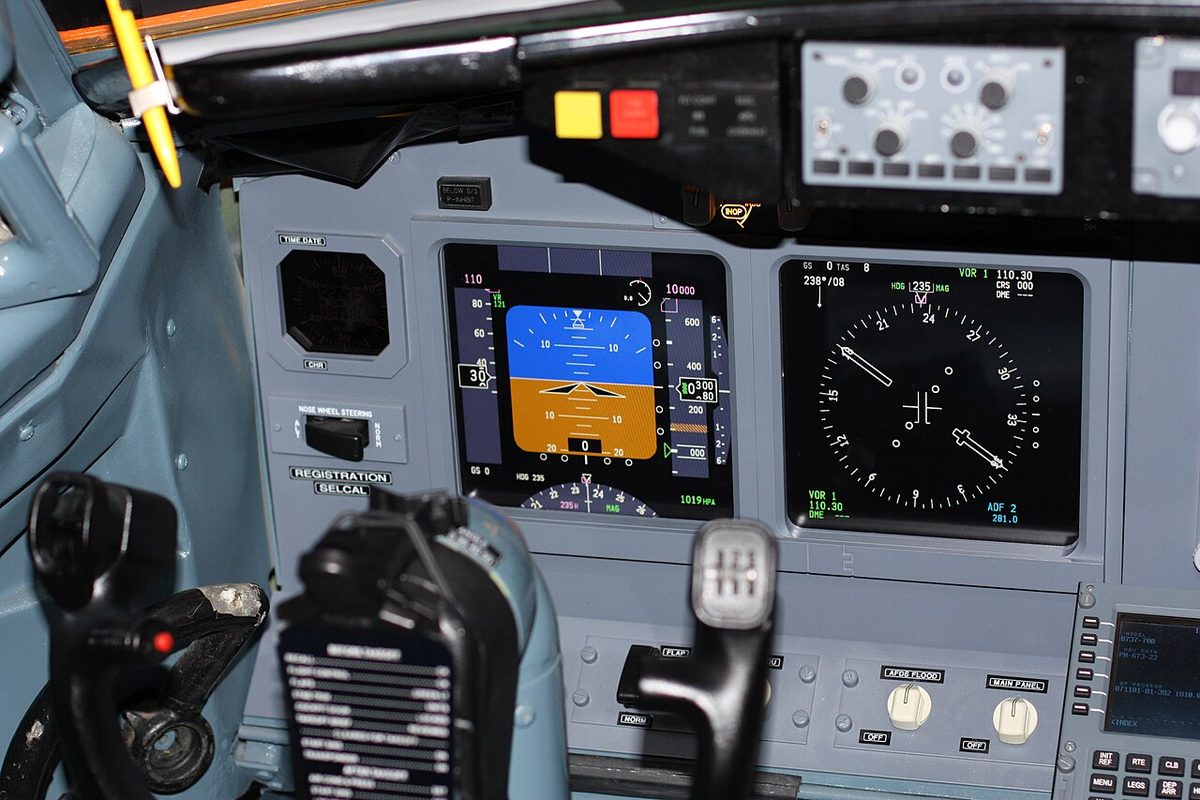
Attitude display and pitch ladder
The attitude display works like the mechanical attitude indicator: a fixed aircraft symbol against an artificial horizon that divides a blue sky from a brown ground. The horizon and the scales move behind the symbol, and the attitude comes from an inertial reference system or an AHRS rather than from a gyro in the instrument.
The pitch ladder, or pitch scale, is a set of lines parallel to the horizon, marked in degrees above and below it. On the 737 NG it is graduated every 2.5°.
Above the horizon a bank pointer moves against a bank scale. On the 737 NG the scale is marked at 0, 10, 20 and 30°, with single marks at 45 and 60°; the pointer fills and turns amber at 35° of bank or more. Beneath the pointer a slip/skid indication, the electronic equivalent of the ball, moves sideways and fills white at full deflection. On the A320 the same index, the sideslip index, turns from yellow to blue and becomes a sideslip target, the beta target, when a large thrust asymmetry is detected in take-off or go-around configurations.
Other symbols appear when they are needed. The 737 NG shows an amber pitch limit indication when the flaps are extended, and at low speed with the flaps up; the A320 shows a tailstrike pitch limit indicator from 400 ft radio height on approach. To keep the picture readable in an upset, the A320 PFD removes all but the essential symbols when the bank exceeds 45°, restoring them below 40°, or when the pitch exceeds 25° nose-up or 13° nose-down.
Exam tip: read the fixed aircraft symbol against the moving horizon, exactly as on a mechanical attitude indicator. The flight director bars are commands, not attitude: they show the attitude the flight director wants, and the pilot flies the symbol to them.
Speed tape
The speed tape is a vertical scale that moves behind a fixed readout box, with higher speeds at the top. On the 737 NG the box shows calibrated airspeed above 45 kt, and a Mach readout appears at M 0.40 and above. Around the tape the display adds:
- the selected speed, a magenta bug and readout showing the speed set on the mode control panel or, when that window is blank, the speed computed by the flight management computer;
- the speed trend vector, a green arrow from the readout whose tip shows the speed the aircraft will reach in 10 seconds at the present acceleration;
- a red and black bar marking the maximum speed, the lowest of VMO or MMO, the landing gear placard speed and the flap placard speed;
- amber bars for the manoeuvre margins: a maximum manoeuvre speed near high-speed buffet and, after the first flap retraction, a minimum manoeuvre speed. If the speed decays into the lower bar, the readout box turns amber and flashes for 10 seconds;
- reference speeds: V1 and VR for take-off, with an amber NO VSPD flag if they have not been entered, flap manoeuvring speed bugs and VREF for landing.
The A320 speed scale carries its own set of characteristic speeds, such as VLS, F, S and green dot, computed by the flight augmentation computers. The meaning of these speeds is covered under airspeed indicator and Machmeter and take-off speeds.
Altitude tape and vertical speed
The altitude tape works the same way. The 737 NG readout shows thousands, hundreds and twenty-foot steps. The selected altitude appears in magenta above the tape. It is only a target: whether the aircraft levels off there depends on the engaged modes, which the annunciator shows. Other features on the 737 NG:
- a green crosshatch symbol below 10,000 ft;
- the barometric setting below the tape, boxed in amber if a local setting is still set when climbing through the transition altitude, or STD when descending below the transition level;
- a barometric minimums pointer, which turns amber when the aircraft descends below it, and a radio altitude readout below 2,500 ft that turns amber below radio minimums;
- an amber crosshatched bar showing the landing altitude of the destination, or of the departure airport early in the flight.
The vertical speed scale sits to the right of the altitude tape. It keeps a pointer because a pointer shows rate at a glance, and on the 737 NG a digital readout appears when the rate exceeds 400 ft/min. During a TCAS resolution advisory the 737 NG shows the pitch region to avoid in red on the attitude display, and on some variants also turns the vertical speeds to avoid red on the vertical speed scale; the pilot keeps the aircraft symbol and the pointer out of the red (see ACAS/TCAS). The mechanics behind these values are covered under pressure altimeter and vertical speed indicator.
Moving tapes versus dials
A moving tape display shows a window of the scale and moves it past a fixed index; a dial moves a pointer over a fixed scale. The human performance part of the ATPL syllabus explains the trade-off:
- a digital readout gives the best precision for a quantity such as fuel on board;
- an analogue pointer gives the best sense of rate and trend, because the eye reads the angle and movement of a pointer at once;
- a pointer combined with a digital readout is best for spotting small changes, such as a slow departure from a cleared level;
- a moving tape is a poor choice where the end point matters, because only part of the scale is visible and the distance to a limit has to be read, not seen.
PFD designers answer these weaknesses directly. The trend vector gives the speed tape back its sense of rate; limit bars bring the end points into the visible window; bugs and boxed readouts mark targets; readouts change colour or flash when a limit is approached; and vertical speed stays a pointer. The counter-pointer altimeter solved the same problem mechanically by combining a drum readout with a pointer.
Note: because higher values are at the top, a tape moves downwards as the value increases. In a climb the altitude numbers scroll down past the readout.
Flight path vector and angle
Pitch attitude is where the nose points; flight path angle (FPA) is the angle between the actual flight path and the horizon. The two differ by the angle of attack of the fuselage, so on a 3° glide path the nose points above the flight path by that angle.
The flight path vector (FPV), often called the bird, displays the flight path directly. Its vertical position against the pitch ladder is the flight path angle, and its sideways offset from the centre of the display is the drift angle. Level flight puts it on the horizon; a 3° approach puts it 3° below the horizon; in a crosswind it sits downwind of the centre by the drift. In wings-level flight the vertical gap between the fixed aircraft symbol and the FPV is the fuselage angle of attack.
On the 737 NG the FPV is selected on the EFIS control panel. It is drawn dim when the flight director or a TCAS resolution advisory is displayed and bright otherwise. Its vertical flight path angle uses inertial and barometric altitude inputs, so it is unreliable whenever the primary altitude displays are unreliable. On the A320 the HDG-V/S / TRK-FPA pushbutton on the flight control unit selects the track and flight path angle reference: both PFDs then show the FPV in green, and the flight path angle can be set between -9.9° and +9.9°. At power-up the selection is HDG-V/S.
An FPA and a vertical speed describe a descent differently. A 3° path descends about 318 ft per nautical mile, so the vertical speed it needs is roughly five times the groundspeed in knots, about 740 ft/min at 140 kt; a selected vertical speed therefore gives a steeper or shallower path as the groundspeed changes, while a selected FPA holds the angle. On the A320 the same knob sets either value, depending on the HDG-V/S / TRK-FPA selection. In the Air Inter Flight 148 accident at Mont Sainte-Odile in 1992, the investigators' leading explanation was that a vertical speed of about 3,300 ft/min had been selected when a 3.3° flight path angle was intended (see controlled flight into terrain).
Warning: the FPV and FPA are computed, not measured. With unreliable air data or inertial inputs they can be wrong while looking perfectly steady; cross-check pitch attitude, thrust and the standby instruments.
Frequently asked questions
How do you read the speed tape on a PFD?
Read the current speed in the box on the fixed index; the tape moves behind it, higher speeds at the top. The magenta bug is the selected speed, the green trend arrow points to the speed expected in 10 seconds, and coloured bars mark the limits: red and black at the top for the maximum speed, amber for the manoeuvre margins. Reference speeds such as V1, VR and VREF appear as labelled bugs beside the tape.
What is the speed trend vector?
The speed trend vector is an arrow that grows from the current speed readout along the speed tape. On the Boeing 737 NG it is green and its tip shows the speed the aircraft will reach in 10 seconds if the present acceleration continues. It restores the rate information a moving tape otherwise hides, so a speed decay or overspeed tendency is visible before the speed itself reaches a limit.
What is the flight path vector on a PFD?
The flight path vector, often called the bird, shows where the aircraft is actually going rather than where it is pointing. Its height against the pitch ladder is the flight path angle and its sideways offset from the centre of the display is the drift angle. On a 3 degree approach it sits on the minus 3 degree line of the pitch ladder. It is computed from inertial and air data, so it is unreliable if altitude is unreliable.
What is the difference between pitch attitude and flight path angle?
Pitch attitude is the angle between the aircraft's longitudinal axis and the horizon, shown by the aircraft symbol against the pitch ladder. Flight path angle is the angle between the actual flight path and the horizon, shown by the flight path vector. The difference is the angle of attack of the fuselage, so on a 3 degree approach the nose points above the flight path by that angle even though the aircraft is descending. The vertical gap between the aircraft symbol and the flight path vector shows it.
Why do PFDs use moving tapes instead of dials?
Tapes save space and let the display add targets, limit bands and trend arrows beside the scale. Their weakness, well known from human-factors research, is that a moving tape shows only a window of the scale and gives a poor sense of rate and of distance to an end point. PFD designers compensate with trend vectors, coloured limit bars, bugs for selected values and readouts that change colour, while vertical speed usually stays a pointer.
Test yourself on Primary Flight Display
The v1prep banks cover this topic in Instrumentation (022), with a worked explanation for every answer. EASA ATPL, PPL, IR and CPL, the FAA written tests and A320/B737 type ratings.
Start practising →Sources and further reading
- FAA Instrument Flying Handbook (FAA-H-8083-15B), Chapter 5, Flight Instruments
- FAA Pilot's Handbook of Aeronautical Knowledge (FAA-H-8083-25), Chapter 8, Flight Instruments
- FAA Advisory Circular AC 25-11B, Electronic Flight Displays
- EASA Easy Access Rules for Large Aeroplanes (CS-25), AMC 25-11, Electronic flight deck displays
- EASA, Explanatory Note to ED Decision 2018/001/R, Part-FCL theoretical knowledge learning objectives (022 Instrumentation)
Library articles are written for study and exam preparation. They do not replace your aircraft's approved documentation, your operator's procedures or the regulations themselves.