Cost Index and Cruise Economics
Cost index is the ratio of an operator's time-related costs to its fuel cost, entered in the flight management system to set the economy (ECON) speeds. A cost index of zero gives maximum range cruise and the least fuel; higher values trade extra fuel for a shorter flight time.
An airliner can fly a sector slowly and burn the least fuel, or fly it fast and arrive sooner at the cost of more fuel. Neither extreme is the cheapest. Fuel is only one of the costs of a flight: crew pay, maintenance charged by the flight hour, the ownership or lease cost of the aircraft and the knock-on cost of a late arrival all grow with time. Cruise economics is the business of finding the speed, level and route that minimise the total.
The flight management system does the arithmetic, driven by a single number set by the operator, the cost index. Behind it sit the classical performance speeds, maximum range and long range cruise, and the ideas of specific range and optimum altitude that ATPL performance and flight planning exams test in detail.
Cost index explained
The cost index (CI) is the ratio of the time-related cost of operating the aircraft to the cost of its fuel. In its usual form it is the operating cost per hour divided by the fuel price per kilogram or pound, so it says how much an hour is worth compared with a unit of fuel. When fuel is expensive compared with time, the cost index is low; when time is expensive, for example on a tight schedule or with high crew and maintenance costs, it is high.
Two values bound the range. CI = 0 means that time costs nothing, so the FMS flies for minimum fuel: maximum range speed in the cruise, low climb and descent speeds, and the longest trip time. At the other end the highest value, 999 on the Airbus A320, gives minimum time. Between the two the operator chooses a value by route and season, and the crew enter it with the other initialisation data, on the INIT page of the A320 or the PERF INIT page of Boeing FMCs. The cost index is company policy; crews still depart from the resulting speeds for ATC, turbulence or schedule reasons.
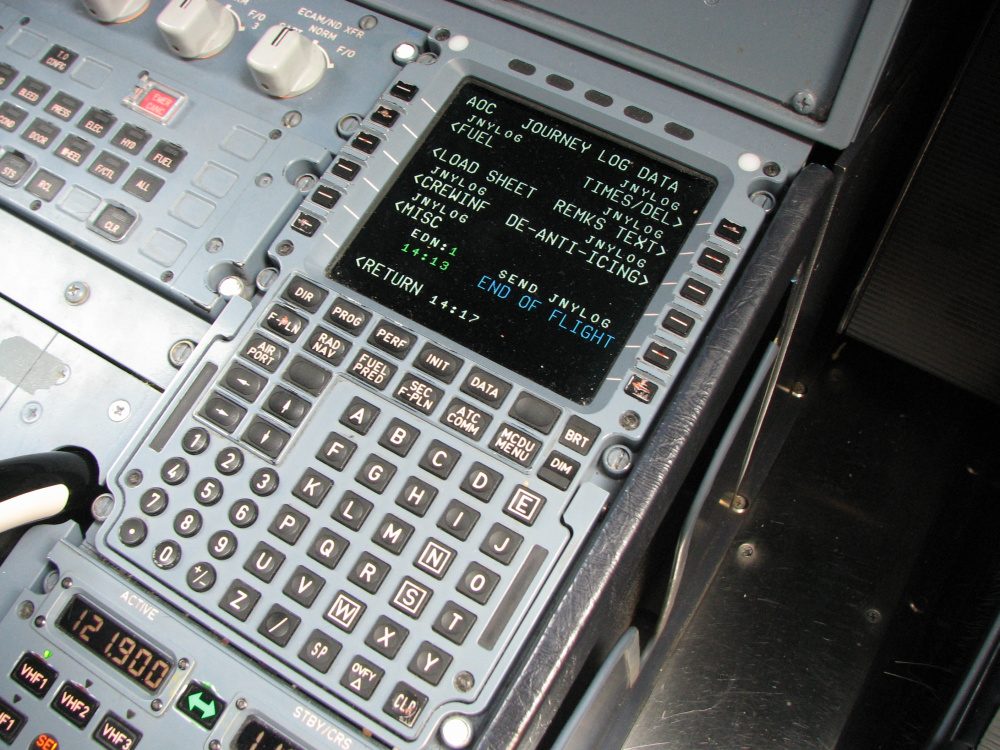
ECON speed
Economy speed (ECON) is the speed that minimises the total trip cost for the entered cost index: the fuel burned multiplied by its price, plus the flight time multiplied by the time cost. The FMS computes it continuously, so ECON is not one number but a schedule that changes with mass, altitude, temperature and wind. The same cost index shapes the climb and descent: once clear of the departure constraints the FMS climbs at ECON climb speed, and it descends from the top of descent at ECON descent speed (see climb and descent planning). On the A320 the cost index also affects the optimum flight level the FMS proposes.
Because a low cost index reflects expensive fuel, it gives a low cruise speed. The underlying best range speeds vary with mass, so they fall as fuel burns off.
Maximum range and long range cruise
Maximum range cruise (MRC) is the speed that gives the greatest still-air distance per unit of fuel. For a jet, whose fuel flow is roughly proportional to thrust and therefore to drag, it is the speed at which drag divided by true airspeed is least: the point where a tangent from the origin touches the drag curve, about 1.32 times the minimum drag speed, VMD. For a propeller aeroplane, whose fuel flow follows power, the best range speed is close to VMD itself. The speeds for greatest endurance are lower: VMD for a jet and the minimum power speed, VMP, for a propeller aeroplane (see power curves and speed stability).

The curve of specific range against speed is very flat near its peak, so flying a little faster than MRC costs almost nothing. Long range cruise (LRC) exploits this: it is the speed above MRC at which specific range has fallen to 99 per cent of the maximum. For 1 per cent more fuel per mile the aircraft gains a useful increase in speed. It is also easier to hold: close to MRC the drag curve is so flat that speed stability is weak. Exam data for a typical medium-range jet give LRC as about M 0.74 within 2,000 ft of the optimum altitude. LRC is the traditional alternative to ECON and is still tabulated in flight manuals.
The best range speed also depends on wind and mass. Into a headwind the aircraft should fly somewhat faster than the still-air best range speed, reducing the time the wind acts on it; with a tailwind, somewhat slower. A heavier aeroplane has a higher best range speed and a lower specific range.
Exam tip: cost index zero gives maximum range, not maximum endurance. The jet's maximum range speed is about 1.32 VMD; its maximum endurance speed is VMD. For a propeller aeroplane, maximum range is at VMD and maximum endurance at VMP.
Specific air range and specific ground range
Specific air range (SAR) is the air distance flown per unit of fuel: true airspeed divided by fuel flow, in nautical air miles (NAM) per kilogram. Specific ground range (SGR) is the ground distance per unit of fuel: groundspeed divided by fuel flow, in nautical ground miles (NGM) per kilogram. The two are equal only in still air, and they are linked by NAM/NGM = TAS/GS. An aeroplane cruising at 150 kt TAS into a 30 kt headwind at 60 litres per hour flies 2.5 NM through the air per litre, but only 2.0 NM over the ground.
Range is the ground distance that can be flown on a given quantity of fuel. Because specific range improves as mass falls, the last tonne of fuel carries the aircraft further than the first, and range cannot be found by simply dividing fuel by an average fuel flow. Jet planning data therefore use an integrated range table. For a given pressure altitude, speed schedule and temperature deviation it tabulates cruise performance against gross mass, with the air distance already integrated over the mass. The planner converts the sector's ground distance to air distance for the wind, enters with the mass at the start of the cruise, moves on by the sector's air distance and reads the mass at the end; the difference is the cruise fuel. An aeroplane heavier than the tabulated mass has a higher fuel flow and a lower specific range, and air warmer than standard is less dense, which is why the tables are entered with the temperature deviation from ISA.
Optimum altitude and step climbs
For each mass there is an optimum altitude at which specific air range is greatest. Climbing raises the true airspeed for a given drag and lets the engines work in colder air, which improves specific range, until the aeroplane must fly at so high a lift coefficient, with its engines so near their limits, that further height costs more than it gains. The optimum rises as fuel burns off, so a heavy aeroplane starts its cruise lower than a light one. Planning data treat a band of about 2,000 ft either side of the optimum as keeping at least 99 per cent of the best specific range; outside it a fuel penalty is added.
The optimum is an economic figure. It is distinct from the maximum altitude, the highest level at which the aeroplane has the thrust and the manoeuvre margin against buffet, commonly 1.3 g or about 40° of bank, to cruise safely (see buffet boundaries and maximum altitude).
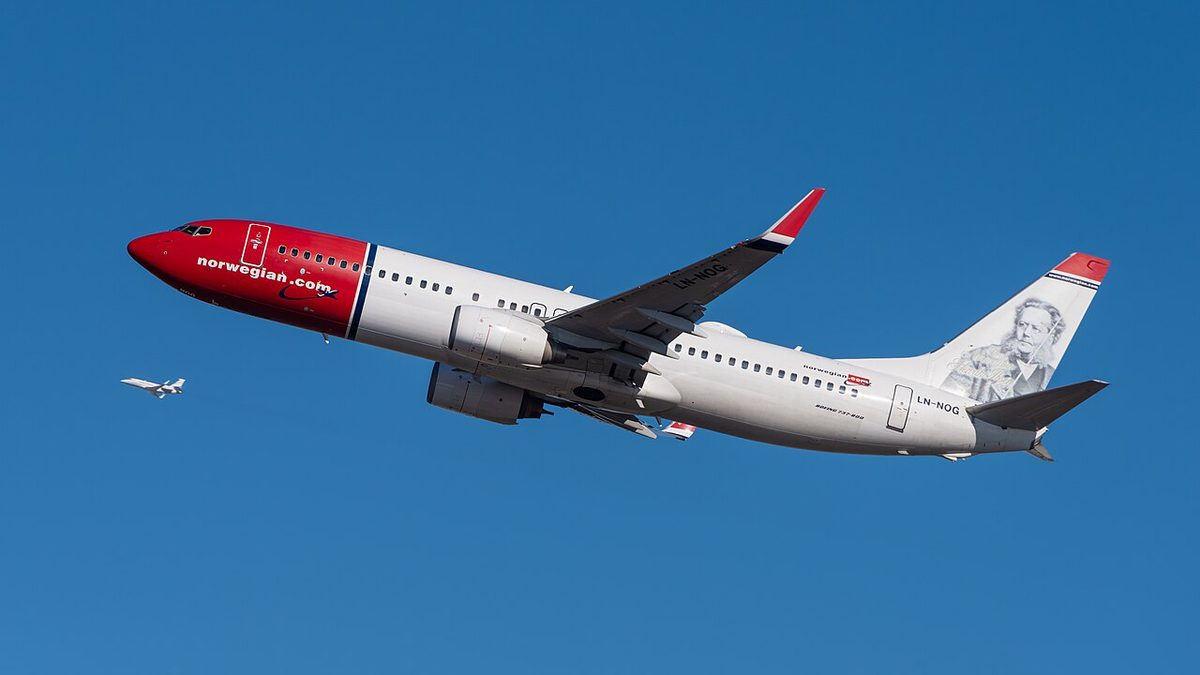
ATC normally assigns fixed flight levels, so a long-haul aeroplane follows its rising optimum in a step climb: when the optimum has risen far enough above the current level, the crew request a climb of typically 2,000 ft or 4,000 ft, depending on the levels available in their direction of flight. Over a long sector there may be several steps. Wind matters as much as height, since a level with a much weaker headwind can give a better ground range than the optimum, and flight planning systems compare levels using the forecast winds.
Cruise climb is the theoretical ideal: a continuous, very shallow climb at constant Mach number and lift coefficient, so that the aeroplane stays at its optimum as its mass falls. It is rarely allowed in controlled airspace, where ATC assigns fixed levels, so step climbs are the practical approximation.
Minimum time routes and block speed
Over long distances the wind decides the best route as much as the distance does. A minimum time route is the track between two points that gives the shortest flight time within ATC and airspace restrictions, taking the forecast wind into account. A great circle into a jet stream can be slower, and dearer, than a longer track that avoids the strongest headwind or rides a tailwind. Airline flight planning systems compute routes, levels and fuel from gridded global forecasts of wind and temperature, and the North Atlantic organised track system is drawn twice a day from the forecast winds on the same principle (see oceanic and North Atlantic operations).
Block speed is the average speed from off-blocks to on-blocks: the sector distance divided by the block time, which includes taxiing, climb, descent and any holding. It is the speed that matters to the schedule and to time-related costs. It also explains why cruise speed choices matter less on a short sector than on a long one: much of the block time is spent in phases that the cruise speed does not affect.
Fuel tankering economics
Fuel tankering means carrying more fuel than the sector needs so as to buy less at the next stop, where fuel is dearer. It is never free: the extra mass raises the fuel burn on the way, so part of the tankered fuel is burned carrying the rest. Planning charts, such as those in the CAP 697 flight planning manual used for EASA exams, give this surplus fuel burn as a percentage of the fuel tankered, and from it the break-even fuel price at the destination: the price at which buying fuel there costs the same as carrying it. Tankering pays only when the destination price is above the break-even price.
A simple case shows the arithmetic. If a quarter of the tankered fuel is burned in carrying it, each kilogram bought at departure delivers 0.75 kg at the destination. With fuel at 1.00 per kilogram at departure, the break-even destination price is 1.00 ÷ 0.75, about 1.33. Below that, it is cheaper to buy at the destination; above it, to tanker.
Several limits apply. The extra fuel must fit within tank capacity, the performance-limited and structural take-off masses and the maximum landing mass at the destination. The charts also assume that the heavier aeroplane can still reach its planned cruise altitude; if the extra mass forces a lower level, the fuel penalty grows and the chart no longer applies. Tankered fuel is carried on top of the fuel the rules require and never replaces a required reserve (see fuel planning and fuel reserves). Every kilogram burned to carry it also adds to the flight's emissions.
Frequently asked questions
What is cost index in aviation?
Cost index is the ratio of the time-related cost of operating an aircraft to the cost of its fuel, typically the operating cost per hour divided by the fuel price per kilogram or pound. The operator sets it and the crew enter it in the flight management system, which then computes economy speeds for climb, cruise and descent that minimise the total of fuel and time costs.
What does a cost index of zero mean?
A cost index of zero means that time is treated as costing nothing, so the flight management system flies for minimum fuel. The cruise speed becomes maximum range cruise, climb and descent speeds are low, and the trip takes longest. It is used when fuel is expensive or scarce. The highest cost index, 999 on the Airbus A320, gives minimum time instead.
What is the difference between maximum range cruise and long range cruise?
Maximum range cruise is the speed that gives the greatest distance per unit of fuel, about 1.32 times the minimum drag speed for a jet. Long range cruise is a slightly higher speed at which specific range has fallen to 99 per cent of the maximum. It costs 1 per cent more fuel per mile but gives a useful gain in speed and is easier to hold.
Why do airliners make step climbs?
As fuel burns off the aircraft becomes lighter and its optimum altitude, where specific air range is best, rises. Air traffic control assigns fixed flight levels, so the aircraft cannot climb continuously; instead the crew request a climb of typically 2,000 or 4,000 ft whenever the optimum has risen far enough above the current level. Each step keeps the aircraft close to its most economical level.
When is fuel tankering worthwhile?
Tankering pays only when the fuel price at the destination is higher than the break-even price. Part of the extra fuel is burned carrying its own weight, so fuel bought at departure is dearer by the time it arrives. The extra mass must also stay within the take-off and landing limits and must not stop the aircraft reaching its planned cruise altitude.
Test yourself on Cost Index and Cruise Economics
The v1prep banks cover this topic in Flight Planning (033), with a worked explanation for every answer. EASA ATPL, PPL, IR and CPL, the FAA written tests and A320/B737 type ratings.
Start practising →Sources and further reading
- EASA, Explanatory Note to ED Decision 2018/001/R, Part-FCL theoretical knowledge learning objectives (032 Performance, 033 Flight Planning and Flight Monitoring)
- UK Civil Aviation Authority, CAP 697, JAR-FCL Examinations Flight Planning Manual
- FAA Pilot's Handbook of Aeronautical Knowledge (FAA-H-8083-25), Chapter 11, Aircraft Performance
- EASA Easy Access Rules for Air Operations (Regulation (EU) No 965/2012), fuel/energy scheme
Library articles are written for study and exam preparation. They do not replace your aircraft's approved documentation, your operator's procedures or the regulations themselves.