Climb and Descent Planning
Climb and descent planning is the part of flight planning that finds the time, fuel and distance needed to climb to the cruising level and to descend from it, and so fixes the top of climb, the top of descent and the end of descent along the route.
A flight plan divides a flight into climb, cruise and descent because each phase burns fuel at a different rate and covers ground at a different speed. The climb is short in distance but heavy in fuel; the descent covers a long distance on little fuel. Treating the whole trip as cruise gives the wrong times, the wrong fuel and the wrong position for the points where the profile changes.
Two points bound the cruise: the top of climb (TOC), where the aircraft reaches its cruising level, and the top of descent (TOD), where it leaves it. Their positions come from time, fuel and distance data in the flight manual or, for European theory examinations, from the specimen data in the UK Civil Aviation Authority's flight planning manual, CAP 697.
CAP 697 and the reference aircraft
CAP 697, the flight planning manual written for the JAR-FCL examinations and still used for EASA flight planning questions, provides planning data for three fictitious reference aircraft, so that every candidate works from the same figures:
- SEP1, a single-engine piston aeroplane;
- MEP1, a multi-engine piston aeroplane;
- MRJT, a medium-range jet transport.
A companion manual, CAP 698, uses the same aircraft for performance questions. The piston data are mostly graphs: fuel, time and distance to climb, cruise power settings and fuel flows, range and endurance, and descent. The jet data are mostly tables: an en-route climb table, cruise and integrated range tables and a descent table for detailed planning, together with charts for simpler cases and for fuel tankering.
Every graph and table carries its conditions: power or thrust setting, speed schedule, configuration, temperature and wind assumptions. The first step with any of them is to read those conditions, because the answer is valid only if the flight is flown the same way. The SEP1 descent, for example, is planned at 145 KIAS and 1,000 ft/min with gear and flaps up.
Top of climb, top of descent and end of descent
The top of climb is placed by the ground distance covered in the climb, measured from the point where the climb begins. The top of descent is the point at which the descent must begin so that the aircraft reaches its planned end altitude at the right place and speed. The flight management system computes it from the cruising level, the descent speed schedule, the wind and the end point; in an idle-thrust descent it places TOD so that no thrust is needed before the approach. The end of descent (E/D) is where the planned descent finishes: typically the initial approach altitude, an altitude constraint in the arrival, or a set height above the destination.
The cruise distance is what remains: route distance minus climb distance minus descent distance. Getting TOC and TOD in the right place matters for more than fuel. The climb and descent are flown at speeds and in winds quite different from the cruise, and ATC crossing restrictions often move them. The fuel for both is part of the trip fuel (see fuel planning and fuel reserves).
Time, fuel and distance to climb
Climb data are cumulative from mean sea level. A table or graph gives, for each pressure altitude, the time, fuel and distance needed to climb to it from sea level, in stated conditions and still air. When the departure aerodrome is above sea level, the values for its elevation are subtracted from those for the cruising level. A light-aeroplane example:
| Pressure altitude | Time | Fuel | Distance |
|---|---|---|---|
| 2,000 ft | 3 min | 2.5 litres | 4 NM |
| 4,000 ft | 7 min | 5.5 litres | 10 NM |
| 6,000 ft | 11 min | 9.0 litres | 17 NM |
| 8,000 ft | 16 min | 13.0 litres | 26 NM |
From an aerodrome at 2,000 ft pressure altitude to 8,000 ft the climb takes 16 − 3 = 13 minutes, 13.0 − 2.5 = 10.5 litres and 26 − 4 = 22 NM. Reading the 8,000 ft line alone would include the first 2,000 ft that is never flown. The fuel shown normally excludes the allowance for start, taxi and take-off, which the flight manual lists separately.
Wind in the climb. Climb distances are still-air distances, in nautical air miles (NAM), so the wind must be applied to find the ground distance to TOC. Because TAS changes through the climb, the simplest correction uses the climb time: nautical ground miles (NGM) = NAM ± (wind component × time in minutes ÷ 60), adding a tailwind and subtracting a headwind. A climb of 11.5 minutes covering 23.5 NAM into a 30 kt headwind covers 23.5 − 5.75, about 18 NM over the ground, so TOC lies 18 NM from the start of the climb, not 23.5 (see triangle of velocities).
En-route climb tables
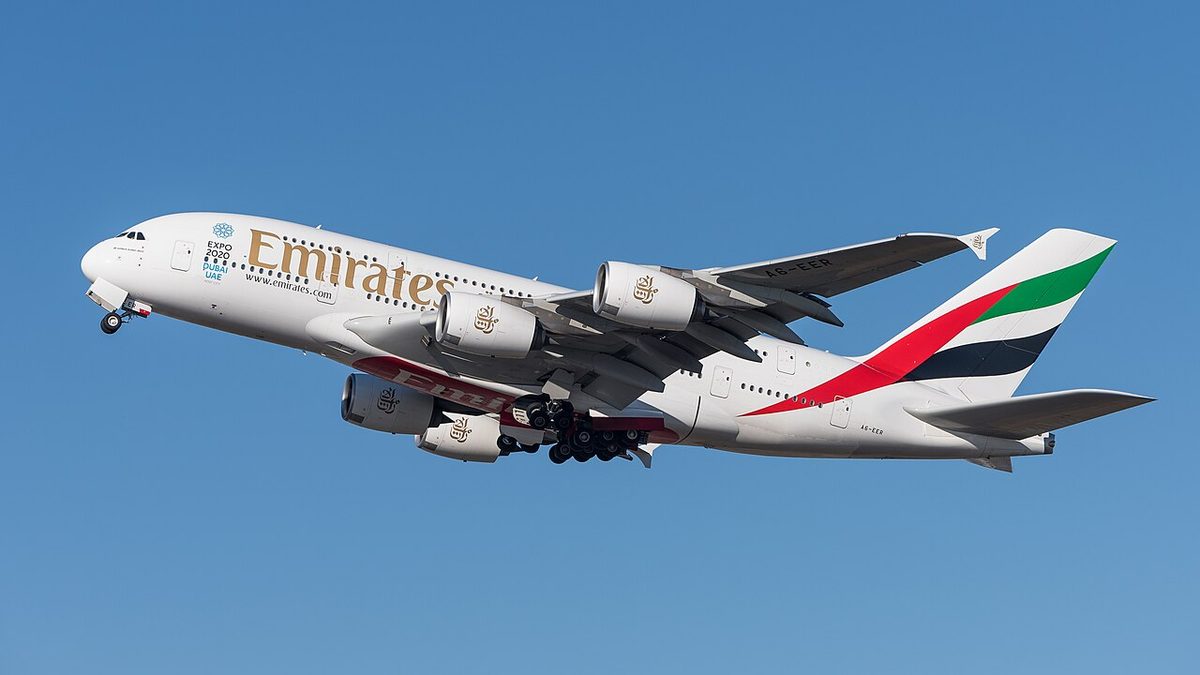
For the jet, the en-route climb table gives the time, fuel and air distance to climb to each cruising level at a set climb speed schedule. It is entered with the aeroplane's mass at the start of the climb and the temperature deviation from ISA. Like the light-aeroplane data, it is referenced to mean sea level, so for a departure from an elevated aerodrome the values to the aerodrome elevation are removed, and the distance is converted from NAM to NGM for the wind.
A jet's climb is flown at a constant IAS until the chosen climb Mach number is reached at the crossover altitude, then at constant Mach to TOC. A typical schedule is 250 kt below 10,000 ft, then an IAS of about 290 to 300 kt, then Mach. A heavier aeroplane, or one in air warmer than standard, climbs more slowly, so the time, fuel and distance to TOC all increase. On short sectors the climb fuel is a significant part of the trip fuel, which is why a slow climb or an off-optimum initial level matters to the plan (see climb performance and cost index and cruise economics).

Descent tables
A descent table gives the fuel, time and distance from the top of descent to a specified end altitude, for a given descent speed schedule and landing mass; like climb distances, the distances are air miles. The planner removes the values below the destination elevation or the planned end-of-descent altitude, and corrects the distance for the wind. A tailwind in the descent carries the aircraft further for each 1,000 ft lost, so TOD moves further from the destination; a headwind brings it closer. The same time-based correction applies as in the climb: a descent of 20 minutes covering 100 NAM with a 30 kt tailwind covers 100 + 10 = 110 NM over the ground, so TOD lies 110 NM before the end of descent.
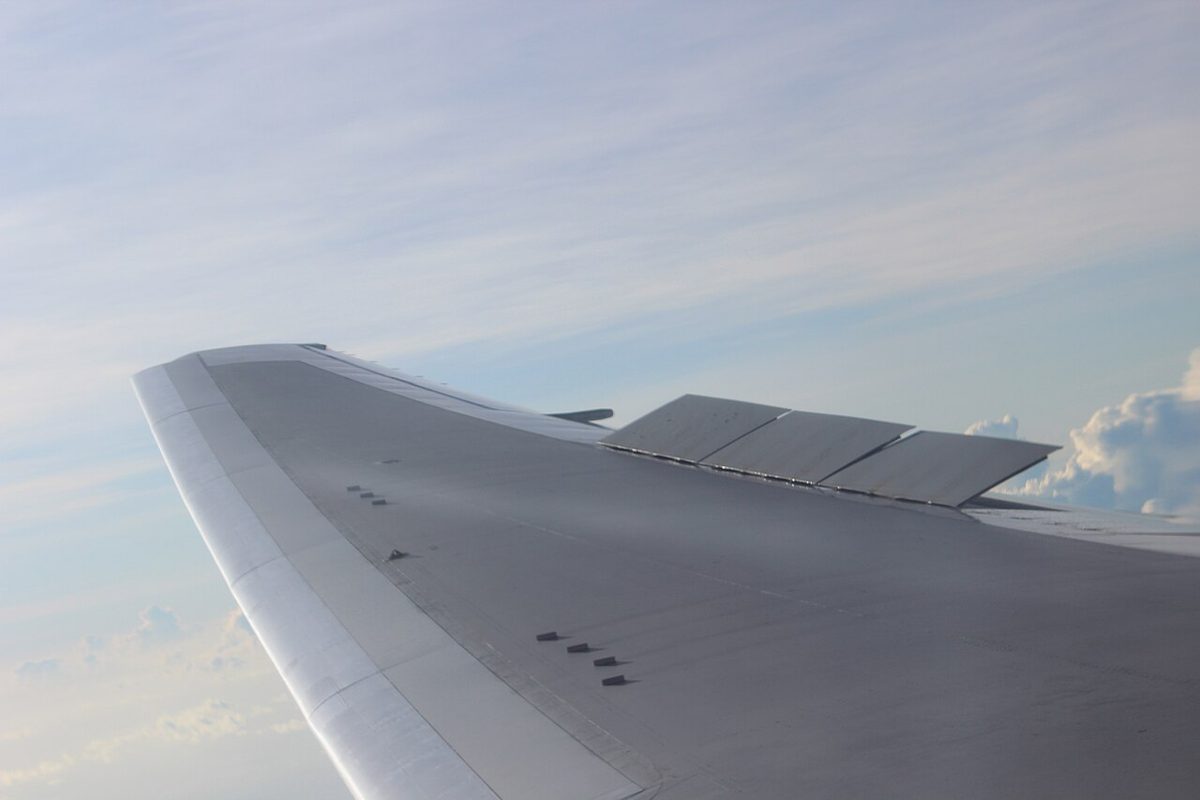
Mass acts in a way that surprises many students. In an idle-thrust descent at a fixed speed schedule a heavier aeroplane descends on a shallower path, because its drag is a smaller fraction of its weight, so it needs more distance and must start down earlier. Speedbrakes do the opposite: they add drag, steepen the path and raise the rate of descent, and are used when the aeroplane is high on the profile or must lose speed.
Light aeroplanes usually descend at a chosen rate of descent at or near cruise speed rather than at idle, so the planning is simple arithmetic: time equals height to lose divided by rate of descent, and distance equals time multiplied by groundspeed. Descending 8,000 ft at 1,000 ft/min takes 8 minutes; at a groundspeed of 150 kt that is 20 NM, which places TOD 20 NM before the point where the descent must end. Power is reduced gradually to avoid shock-cooling the cylinders.
Idle descent and the end of descent
A jet normally descends from TOD at idle thrust. This is the most fuel-efficient descent, since it spends the energy stored in height and speed instead of burning fuel, and it is the design case for FMS descent planning. The idle descent path is the vertical profile the aeroplane follows at idle thrust on the planned speed schedule. The FMS computes it backwards from the end of the descent, taking the speed and altitude constraints of the arrival into account: the A320's FMGS, for example, calculates its top of descent backwards from a point at 1,000 ft on the final approach, flown at the approach speed, VAPP. Boeing's VNAV offers two modes: in a path descent the FMC holds the computed path with pitch at idle thrust; in a speed descent it holds the target speed at idle, and the path is whatever results. Above the crossover altitude the descent is flown at constant Mach, with IAS increasing; below it at constant IAS, with TAS falling as the air becomes denser.
Pilots check the FMS with rules of thumb:
- Distance to descend: about 3 NM for every 1,000 ft to lose. From FL350 to sea level, 35 × 3 = 105 NM, plus distance to slow down and an allowance for a tailwind.
- Rate of descent on a 3° path: about 5 × groundspeed in knots. At 140 kt, about 700 ft/min; the exact figure is about 740 ft/min.
- Gradient check: a 3° path is about 318 ft per NM, or 5.2 per cent. Losing 25,000 ft in 100 NM needs only 250 ft per NM, about 4.1 per cent or 2.4°.
The times and fuel worked out for the climb, cruise and descent go into the operational flight plan, and in flight the crew compare them with the actual figures at each check (see in-flight fuel management).
Exam tip: climb and descent tables are cumulative from mean sea level, so subtract the values for the aerodrome elevation or end altitude. Their distances are air distances, so convert them to ground distances with the wind before placing TOC or TOD. And in an idle descent, a heavier aeroplane starts down earlier, not later.
Frequently asked questions
How do you find the time, fuel and distance to climb from an aerodrome above sea level?
Climb tables and graphs are cumulative from mean sea level, so the values for the aerodrome's pressure altitude are subtracted from those for the cruising level. With 16 minutes, 13 litres and 26 NM to 8,000 ft and 3 minutes, 2.5 litres and 4 NM to 2,000 ft, the climb from a 2,000 ft aerodrome takes 13 minutes, 10.5 litres and 22 NM.
What is CAP 697?
CAP 697 is the flight planning manual published by the UK Civil Aviation Authority for the European pilot theory examinations. It gives planning data for three fictitious reference aircraft: a single-engine piston aeroplane (SEP1), a multi-engine piston aeroplane (MEP1) and a medium-range jet transport (MRJT). Every candidate works from the same graphs and tables, so exam answers can be checked exactly.
How far from the destination should a descent start?
A quick check is 3 NM for every 1,000 ft to lose, so a descent from FL350 to sea level needs about 105 NM, plus distance to slow down. A tailwind moves the top of descent further out and a headwind brings it closer. In an idle descent a heavier aircraft also needs to start earlier. The FMS computes the exact point from the planned speeds and forecast winds.
Why must climb and descent distances be corrected for wind?
Planning tables give still-air distances, nautical air miles, while the top of climb and top of descent must be placed on the ground track. The correction uses the time in the climb or descent: ground distance equals air distance plus the wind component multiplied by the time in minutes divided by 60, adding a tailwind and subtracting a headwind.
What is the difference between top of descent and end of descent?
The top of descent is the point where the aircraft leaves its cruising level to begin the descent. The end of descent is where the planned descent ends, typically at the initial approach altitude, at the level of an arrival constraint or at a set height above the destination. The descent table and the descent distance are worked between those two points.
Test yourself on Climb and Descent Planning
The v1prep banks cover this topic in Flight Planning (033), with a worked explanation for every answer. EASA ATPL, PPL, IR and CPL, the FAA written tests and A320/B737 type ratings.
Start practising →Sources and further reading
- UK Civil Aviation Authority, CAP 697, JAR-FCL Examinations Flight Planning Manual
- EASA, Explanatory Note to ED Decision 2018/001/R, Part-FCL theoretical knowledge learning objectives (033 Flight Planning and Flight Monitoring)
- FAA Pilot's Handbook of Aeronautical Knowledge (FAA-H-8083-25), Chapter 11, Aircraft Performance
- FAA Instrument Procedures Handbook (FAA-H-8083-16B), Arrivals
- FAA Airplane Flying Handbook (FAA-H-8083-3C)
Library articles are written for study and exam preparation. They do not replace your aircraft's approved documentation, your operator's procedures or the regulations themselves.